|
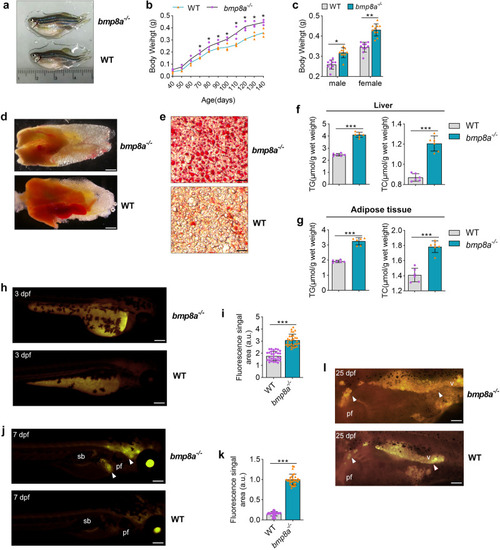
Obesogenic phenotype of bmp8a-/- zebrafish.] a Representative photograph of WT and bmp8a-/- zebrafish (n = 10). b Body weight changes of WT and bmp8a-/- zebrafish (n = 30). c WT and bmp8a-/- (male or female) zebrafish body weight at 140 days (n = 10). d Representative photographs of WT and bmp8a-/- zebrafish visceral mass (n = 6). Scale bars = 1 mm. e Fatty liver changes were revealed by histopathological sections (n = 6). Scale bars = 20 μm. f, g The TG and TC level in WT and bmp8a-/- zebrafish (f, n = 6) or adipose tissue (g, n = 6). h–k Representative photographs WT and bmp8a-/- zebrafish at 3 dpf (h, i, n = 30) or 7dpf (j, k, n = 30) were stained with Nile Red. Scale bars = 300 μm. The fluorescence signal area was calculated by ImageJ software. l Representative Nile Red staining images of WT and bmp8a-/- zebrafish at 25 dpf (n = 10). Scale bars = 300 μm. Swim bladder (sb), pectoral fin (pf), viscera (v). Data were representative of at least three independent experiments. Data were analyzed by two-tailed Student’s t-test and presented as mean ± SD (*p < 0.05, **p < 0.01, ***p < 0.001).
|