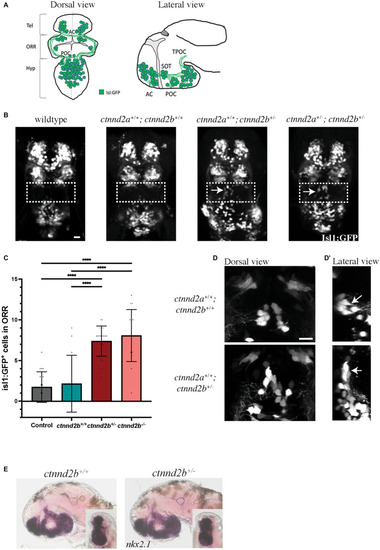
FIGURE 1 (Continued)(A,B) Schematic illustration of the isl1:GFP-expressing neuron population in the forebrain of wildtype 48 hpf zebrafish embryos. (B) Heterozygous loss of ctnnd2b results in ectopic isl1:GFP-expressing cells in the ORR (arrows), not detected in control embryos. Wildtype: embryos obtained from an incross of Tg(isl1:GFP) line; ctnnd2a+/+,ctnnd2b+/+: non-carriers from the incross of the ctnnd2a+/−,ctnnd2b+/− line. (C) Quantification of Isl1:GFP-positive neurons in the ORR confirmed that heterozygous and homozygous loss of ctnnd2b result in ectopic Isl1-positive cells in the region. (D) In ctnnd2b+/− embryos the ectopic Isl1:GFP-positive cells display a vertical rather than horizontal orientation (arrows, lateral view in D′) and the cluster seems more disorganized when compared to these cells in control (ctnnd2a+/+,ctnnd2b+/+) embryos. (E) Control and ctnnd2b+/− 54 hpf embryos show no difference in nkx2.1 expression, investigated in lateral and rostral (inset) views. Dashed box: ORR; Tel: telencephalon; ORR: optic recess region; Hyp: hypothalamus; AC: anterior commissure; POC: post-optic commissure; SOT: supraoptic tract; TPOC: tract of the POC; ****p < 0.0001. Scale bar =10 μm.
|
