
Figure 1
- ID
- ZDB-IMAGE-230719-1
- Genes
- Publication
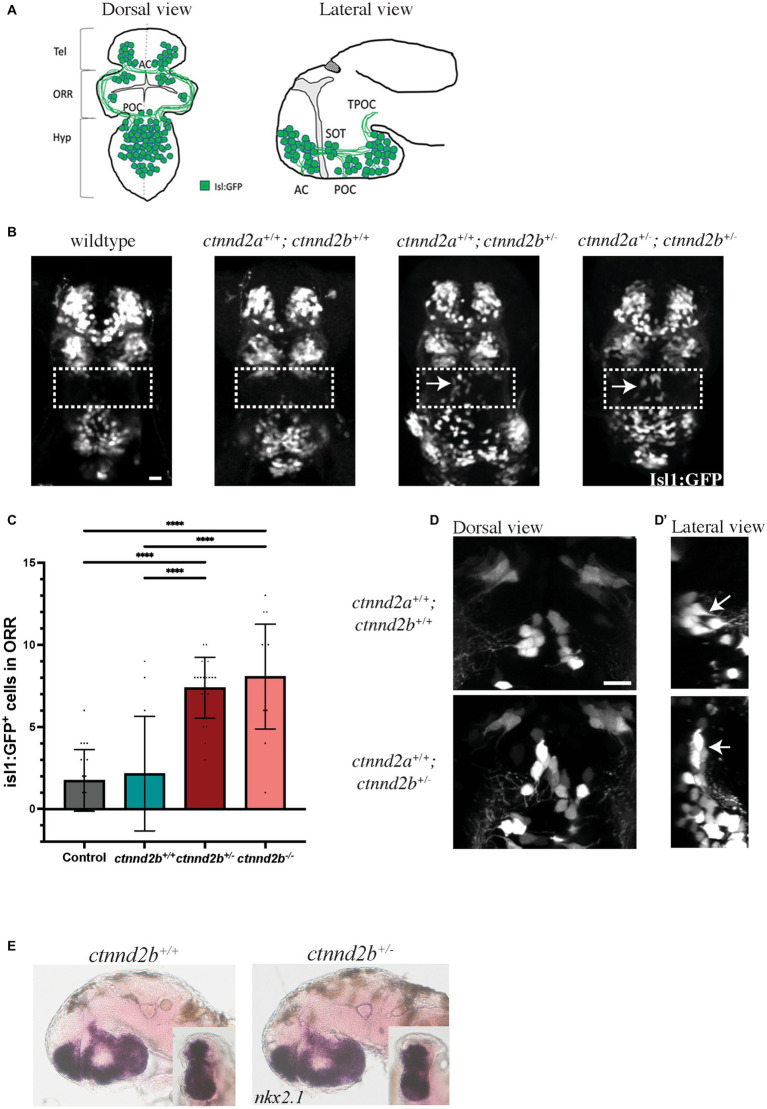
- Vaz et al., 2023 - Loss of ctnnd2b affects neuronal differentiation and behavior in zebrafish
- All Figures
- Figures for Vaz et al., 2023
|
Figure 1
FIGURE 1 (Continued)