Fig. 4
- ID
- ZDB-FIG-230717-106
- Publication
- Park et al., 2023 - Label-free adaptive optics single-molecule localization microscopy for whole zebrafish
- Other Figures
- All Figure Page
- Back to All Figure Page
|
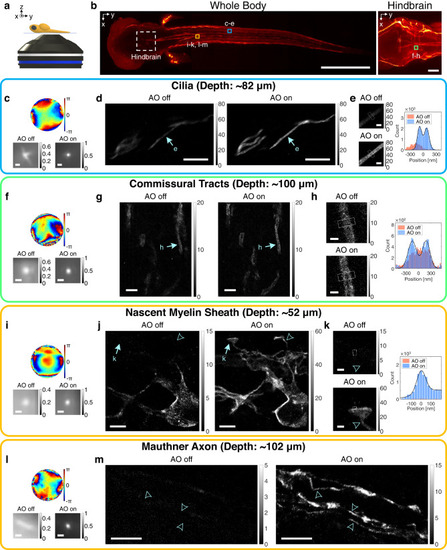
a A diagram showing a whole zebrafish larva mounted on a cover glass. b Confocal fluorescence images of the whole body (left column) and hindbrain (right column). Dashed square indicates hindbrain region. Colored squares roughly indicate SMLM imaging regions. Scale bars indicate 500 μm (left column) and 50 μm (right column). c–e SMLM imaging of cilia in a whole 3-dpf zebrafish at the depth of 82 μm. Aberration correction map (top row in c), ensemble-averaged normalized PSFs of the first 10,000 frames (bottom row in c), and SMLM images (d). Magnified views of regions indicated by arrows in (d) (left column in e) and cross-sectional profiles of white boxes (right column in e). Color bars in (d, e) indicate localization numbers. Scale bars indicate 500 nm (c), 5 μm (d), and 500 nm (e). f–h Same as (c–e), but for oligodendrocytes at the hindbrain in a whole 5-dpf zebrafish at the depth of 100 μm. Scale bars indicate 500 nm (f), 2.5 μm (g), and 500 nm (h). i–k Same as (f–h), but for oligodendrocytes near spinal cords in a whole 3.5-dpf zebrafish at the depth of 52 μm. Scale bars indicate 500 nm (i), 2.5 μm (j), and 500 nm (k). l, m Same as (i, j), but for oligodendrocytes near spinal cords in a whole 5-dpf zebrafish at the depth of 102 μm. Arrowheads indicate sites with FWHM measured as 160, 150, and 160 nm from bottom to top. Scale bars indicate 500 nm (l) and 5 μm (m). Source data are provided as a Source Data file. |

