
Figure 4
- ID
- ZDB-FIG-230709-4
- Publication
- Cahill et al., 2023 - Transcriptome Profiling Reveals Enhanced Mitochondrial Activity as a Cold Adaptive Strategy to Hypothermia in Zebrafish Muscle
- Other Figures
- All Figure Page
- Back to All Figure Page
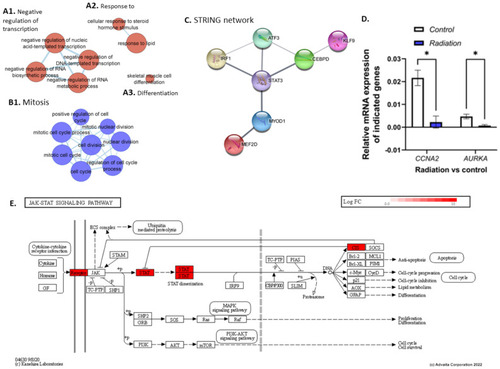
Clusters (A,B) were generated using EnrichmentMap and up (red) and downregulated (blue) genes, respectively. Cluster (A1) shows GO terms related to the negative regulation of transcription. (A2) shows a response to steroid hormone stimulus and lipids while (A3) shows skeletal muscle cell differentiation. (B1) shows downregulation of GO terms related to cell division. (C) shows a string network generated using the DNA transcription factor activity GO term (GO:0001216), showing protein interaction between STAT3 and MYOD1. (D) shows results from the qPCR analysis which shows significant downregulation of CCNA2 and AURKA in the radiation group compared with controls (28.5-rad vs. 28.5-Ctrl). (E) shows genes upregulated in the JAK/STAT pathway in the radiation vs control group. * p < 0.05. |