
|
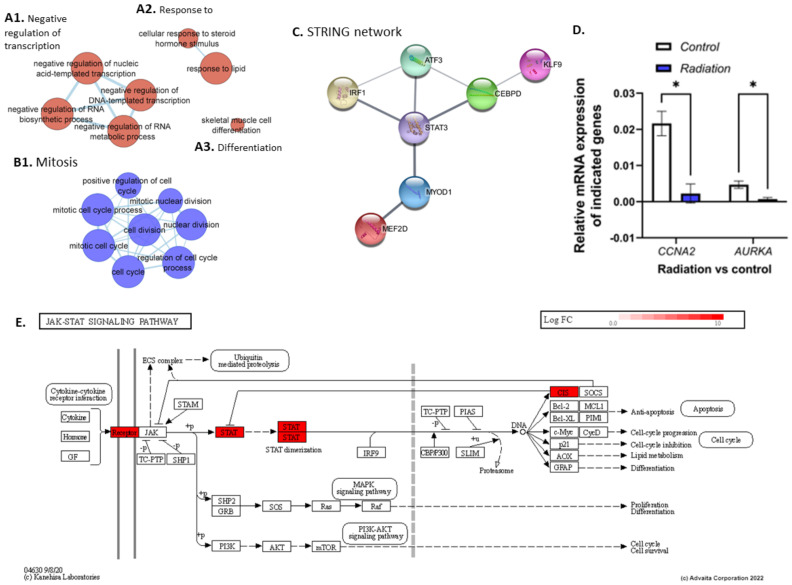
Figure 4
Clusters (A,B) were generated using EnrichmentMap and up (red) and downregulated (blue) genes, respectively. Cluster (A1) shows GO terms related to the negative regulation of transcription. (A2) shows a response to steroid hormone stimulus and lipids while (A3) shows skeletal muscle cell differentiation. (B1) shows downregulation of GO terms related to cell division. (C) shows a string network generated using the DNA transcription factor activity GO term (GO:0001216), showing protein interaction between STAT3 and MYOD1. (D) shows results from the qPCR analysis which shows significant downregulation of CCNA2 and AURKA in the radiation group compared with controls (28.5-rad vs. 28.5-Ctrl). (E) shows genes upregulated in the JAK/STAT pathway in the radiation vs control group. * p < 0.05.