
Figure 5
- ID
- ZDB-FIG-230709-19
- Publication
- Yasmin et al., 2023 - Role of Chemokine Cxcl12a in Mediating the Stimulatory Effects of Ethanol on Embryonic Development of Subpopulations of Hypocretin/Orexin Neurons and Their Projections
- Other Figures
- All Figure Page
- Back to All Figure Page
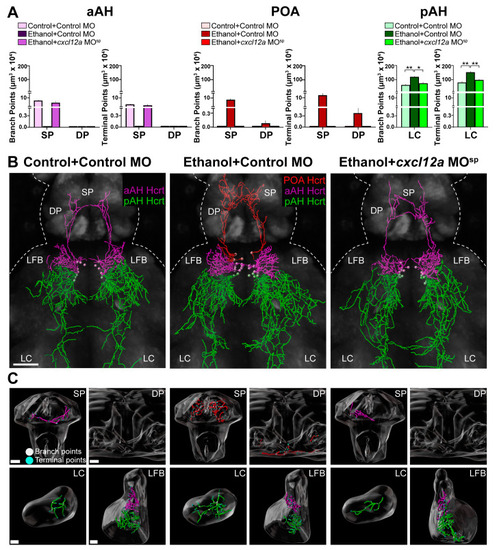
Effects of exposure to embryonic ethanol (0.5% v/v, 22–24 hpf) and injection of cxcl12a MOsp (850 ng/µL) with ethanol on the density of branch points and terminal points of the projections in different brain areas from Hcrt neurons in the aAH, POA and pAH of 6 dpf transgenic Hcrt:EGFP zebrafish. (A) Bar graphs (n = 4–6/group) with purple-colored bars show projection data of Hcrt neurons located in the aAH and their branch points (left) and terminal points (right) in the SP and DP. Bar graphs (n = 4–6/group) with red-colored bars show projection data of Hcrt neurons located in the POA and their branch points (left) and terminal points (right) in the SP and DP. Bar graphs (n = 4–6/group) with green-colored bars show projection data of Hcrt neurons located in the pAH and their branch points (left, F (3, 15) = 4.89, p = 0.014) and terminal points (right, F (3, 15) = 8.34, p = 0.002) in the LC. (B) Images show digital representations of Hcrt neuronal projections created from photomicrographs (25×, dorsal view) of Control + Control MO-injected zebrafish (left), Ethanol + Control MO-injected zebrafish (middle) and Control + cxcl12a MOsp-injected zebrafish (right) obtained using confocal microscopy using the “Filaments” function of Imaris software. The primarily ascending aAH Hcrt projections are shown in purple, the ascending POA Hcrt projections in red and the primarily descending pAH Hcrt projections are shown in green. (C) Digitally constructed enlargements of the SP, DP, LC and LFB containing Hcrt projections from the aAH (purple), POA (red) and pAH (green) are shown below, with branch points indicated by white dots and terminal points indicated by blue dots. Scale bars: low magnification 50 µm; SP: 15 µm; DP: 15 µm; LC: 10 µm; LFB: 10 µm. All results are shown as means ± standard errors. * p < 0.05, ** p < 0.01Abbreviations: aAH: anterior part of the anterior hypothalamus, POA: preoptic area, pAH: posterior part of the anterior hypothalamus, LFB: lateral forebrain bundle, SP: subpallium, DP: dorsal pallium, LC: locus coeruleus, Hcrt: hypocretin, hpf: hours post fertilization, dpf: days post fertilization. |