
- Title
-
Role of Chemokine Cxcl12a in Mediating the Stimulatory Effects of Ethanol on Embryonic Development of Subpopulations of Hypocretin/Orexin Neurons and Their Projections
- Authors
- Yasmin, N., Collier, A.D., Abdulai, A.R., Karatayev, O., Yu, B., Fam, M., Leibowitz, S.F.
- Source
- Full text @ Cells
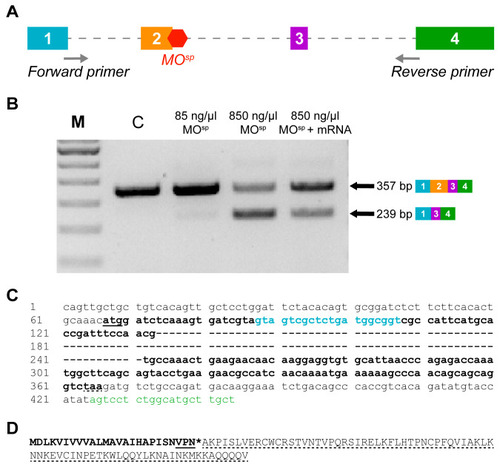
Verification of the efficiency of injection of a splice-altering cxcl12a MO (MOsp) and of the rescue with cxcl12a mRNA in zebrafish embryo. (A) A schematic representation of cxcl12a pre-mRNA showing its 4 exons, introns (dotted line) and the binding position of MOsp on exon 2 to cause alternate splicing. The positions of the MOsp detection primers (designed to obtain product smaller than full-length gene of 1521 bp), which partially spans exons 1 and 4 and the full length of exons 2 and 3, are shown. (B) RT-PCR analysis of Cxcl12a transcript confirming the splice-altering effect of MOsp (850 ng/µL) compared to embryos injected with control MO. A low dose (85 ng/µL) MOsp has no marked splice-altering effect, whereas MOsp + mRNA shows rescue of wild-type (WT) product and increases its expression. M is a 100 bp ladder. A smaller PCR product (239 bp) was observed from MOsp-injected embryos because exon 2 (118 bp) was completely skipped; the WT product was 357 bp. (C) A segment of the cxcl12a gene is shown. The underline and dotted underline show the start and stop codons, respectively. The nucleotides in bold show the coding sequence (cds), whereas the hyphens show the 118 nucleotides of exon 2 that were excised after MOsp injection. Finally, the colored nucleotides show the positions of the forward primer (blue) on exon 1 and the reverse primer (green) on exon 4. (D) The resulting truncated transcript, which has 77 amino acids removed (dotted underline), is expected to be only 25 amino acids long (bold) and has 3 new insertions (underline). The asterisk shows the premature stop codon. |
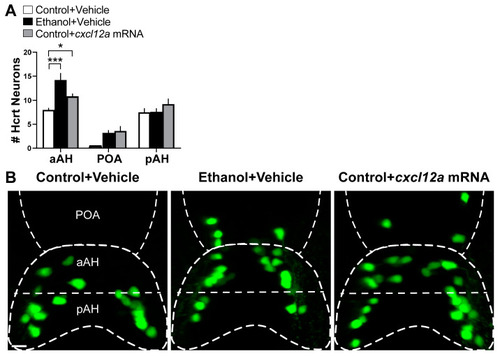
Effects of exposure to embryonic ethanol (0.5% v/v, 22–24 hpf) and injection of cxcl12a mRNA (50 ng/µL) on the number of Hcrt neurons in the aAH, POA and pAH of 6 dpf Hcrt:EGFP zebrafish. (A) Bar graphs (n = 4–5/group) show the number of Hcrt neurons in the aAH, POA and pAH (Two-way ANOVA, Condition main effect: (F (2, 33) = 8.577, p = 0.0009), Brain area main effect: (F (2, 33) = 68.52, p < 0.0001), Condition ×Brain area interaction: (F (4, 33) = 3.431, p = 0.019), followed by Holm–Sidak post-hoc analysis). (B) Photomicrographs (25×, dorsal view) illustrate Hcrt neurons (green) that are located in the aAH, POA and pAH of Control + Vehicle (left), Ethanol + Vehicle (middle) and Control + cxcl12a mRNA (right) zebrafish. Scale bar: 10 µm. All results are shown as means ± standard errors. * p < 0.05, *** p < 0.001. Abbreviations: aAH: anterior part of the anterior hypothalamus, POA: preoptic area, pAH: posterior part of the anterior hypothalamus, Hcrt: hypocretin, hpf: hours post fertilization, dpf: days post fertilization. |
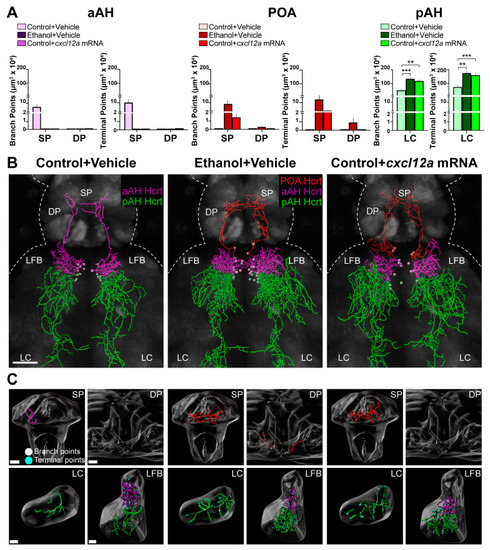
Effects of exposure to embryonic ethanol (0.5% v/v, 22–24 hpf) and injection of cxcl12a mRNA (50 ng/µL) on the density of branch points and terminal points in different brain areas of the projections from Hcrt neurons in the aAH, POA and pAH subpopulations of 6 dpf Hcrt:EGFP zebrafish. (A) Bar graphs (n = 4–5/group) with purple-colored bars show projection data of aAH Hcrt neurons and their branch points (left) and terminal points (right) in the SP and DP. Bar graphs (n = 4–5/group) with red-colored bars show projection data of ectopic POA Hcrt neurons and their branch points (left) and terminal points (right) in the SP and DP. Bar graphs (n = 4–5/group) with green-colored bars show projection data of pAH Hcrt neurons and their branch points (left, F (2, 10) = 17.14, p = 0.0006) and terminal points (right, F (2, 10) = 15.91, p = 0.008) in the LC. (B) Images show digital representations of Hcrt neuronal projections, created from photomicrographs (25×, dorsal view) of the Control + Vehicle-injected (left), Ethanol + Vehicle-injected (middle) and Control + cxcl12a mRNA-injected (right) zebrafish, obtained using confocal microscopy with the “Filaments” function of Imaris software. As with the bar graph data, the primarily ascending aAH Hcrt projections are shown in purple, the ascending POA Hcrt projections are shown in red and the primarily descending pAH Hcrt projections are shown in green. (C) Digitally constructed enlargements of the projections in the SP, DP, LC and LFB from the aAH (purple), POA (red) and pAH (green) Hcrt neurons are shown below, with branch points indicated by white dots and terminal points indicated by blue dots. Scale bars: low magnification 50 µm; SP: 15 µm; DP: 15 µm; LC: 10 µm; LFB: 10 µm. All results are shown as means ± standard errors. ** p < 0.01, *** p < 0.001. Abbreviations: aAH: anterior part of the anterior hypothalamus, POA: preoptic area, pAH: posterior part of the anterior hypothalamus, LFB: lateral forebrain bundle, SP: subpallium, DP: dorsal pallium, LC: locus coeruleus, Hcrt: hypocretin, hpf: hours post fertilization, dpf: days post fertilization. |
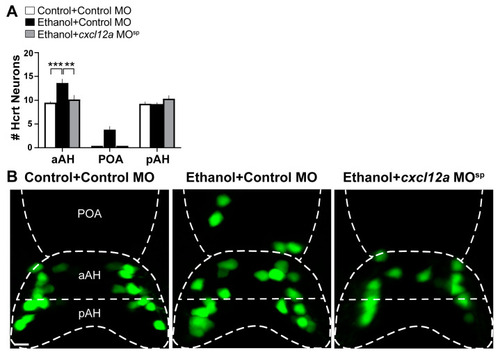
Effects of exposure to embryonic ethanol (0.5% v/v, 22–24 hpf) and injection of cxcl12a MOsp (850 ng/µL) on the number of Hcrt neurons in the aAH, POA and pAH subpopulations of 6 dpf transgenic Hcrt:EGFP zebrafish brains. (A) Bar graphs (n = 4–6/group) show the number of Hcrt neurons in the aAH, POA and pAH. (Two-way ANOVA, Condition main effect: (F (3, 45) = 7.765, p = 0.0003), Brain area main effect: (F (2, 45) = 209.4, p < 0.0001), Condition ×Brain area interaction: (F (6, 45) = 4.381, p = 0.014), followed by Holm–Sidak post-hoc analysis). (B) Photomicrographs (25×, dorsal view) illustrate Hcrt neurons (green) that are located in the aAH and pAH of Control + Control MO (left), Ethanol + Control MO (middle) and Ethanol + cxcl12a MOsp (right). Scale bar: 10 µm. All results are shown as means ± standard errors. ** p < 0.01, *** p < 0.001. Abbreviations: MO: morpholino, aAH: anterior part of the anterior hypothalamus, POA: preoptic area, pAH: posterior part of the anterior hypothalamus, Hcrt: hypocretin, hpf: hours post fertilization, dpf: days post fertilization. |
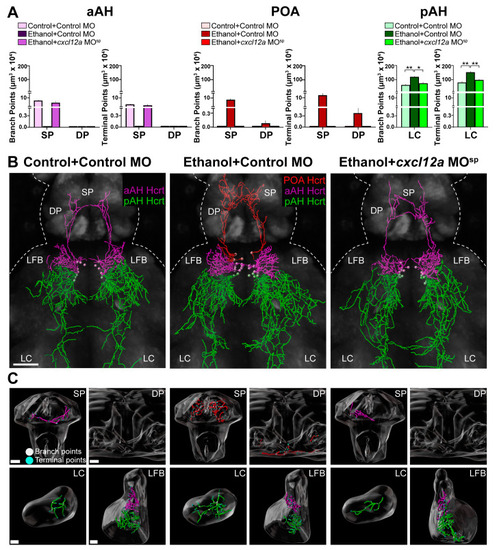
Effects of exposure to embryonic ethanol (0.5% v/v, 22–24 hpf) and injection of cxcl12a MOsp (850 ng/µL) with ethanol on the density of branch points and terminal points of the projections in different brain areas from Hcrt neurons in the aAH, POA and pAH of 6 dpf transgenic Hcrt:EGFP zebrafish. (A) Bar graphs (n = 4–6/group) with purple-colored bars show projection data of Hcrt neurons located in the aAH and their branch points (left) and terminal points (right) in the SP and DP. Bar graphs (n = 4–6/group) with red-colored bars show projection data of Hcrt neurons located in the POA and their branch points (left) and terminal points (right) in the SP and DP. Bar graphs (n = 4–6/group) with green-colored bars show projection data of Hcrt neurons located in the pAH and their branch points (left, F (3, 15) = 4.89, p = 0.014) and terminal points (right, F (3, 15) = 8.34, p = 0.002) in the LC. (B) Images show digital representations of Hcrt neuronal projections created from photomicrographs (25×, dorsal view) of Control + Control MO-injected zebrafish (left), Ethanol + Control MO-injected zebrafish (middle) and Control + cxcl12a MOsp-injected zebrafish (right) obtained using confocal microscopy using the “Filaments” function of Imaris software. The primarily ascending aAH Hcrt projections are shown in purple, the ascending POA Hcrt projections in red and the primarily descending pAH Hcrt projections are shown in green. (C) Digitally constructed enlargements of the SP, DP, LC and LFB containing Hcrt projections from the aAH (purple), POA (red) and pAH (green) are shown below, with branch points indicated by white dots and terminal points indicated by blue dots. Scale bars: low magnification 50 µm; SP: 15 µm; DP: 15 µm; LC: 10 µm; LFB: 10 µm. All results are shown as means ± standard errors. * p < 0.05, ** p < 0.01Abbreviations: aAH: anterior part of the anterior hypothalamus, POA: preoptic area, pAH: posterior part of the anterior hypothalamus, LFB: lateral forebrain bundle, SP: subpallium, DP: dorsal pallium, LC: locus coeruleus, Hcrt: hypocretin, hpf: hours post fertilization, dpf: days post fertilization. |