
Fig. 3
- ID
- ZDB-FIG-230705-6
- Publication
- Leesch et al., 2023 - A molecular network of conserved factors keeps ribosomes dormant in the egg
- Other Figures
- All Figure Page
- Back to All Figure Page
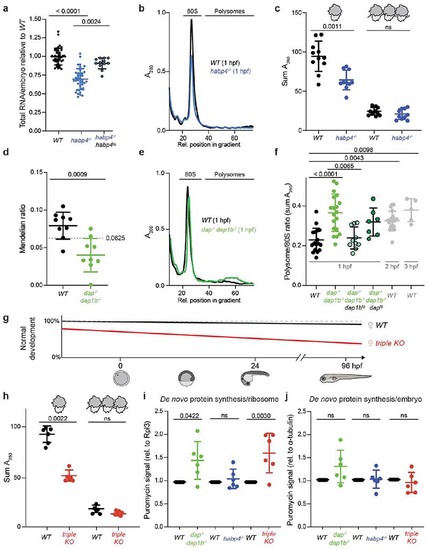
Habp4 stabilizes monosomes, while Dap1b/Dap represses translation in embryos.
a, RNA isolated from wild-type (WT), habp4-/- and transgenic habp4-/- embryos expressing Habp4 (habp4-/-, habp4tg) (WT: n = 40; habp4-/-: n = 40; habp4-/-, habp4tg: n = 12). b, Representative polysome profiles from WT and habp4-/- embryos at 1 hour post-fertilization (hpf). A260, absorbance at 260 nm. c, Quantification of monosomes and polysomes from 1 hpf embryos (WT: n = 11; habp4-/-: n = 10). d, Mendelian ratio analysis of fin-clipped adult fish. Adult dap-/-, dap1b-/- and WT fish are expected at 6.25% from a dap+/-, dap1b+/- incross (n = 9 independent crosses; heterozygous combinations are not shown; total number of fish genotyped: 1029). e, Representative polysome profiles from 1 hpf WT and dap-/-, dap1b-/- embryos. f, Quantification of polysome-to-monosome ratios of 1 hpf embryos derived from WT, dap-/-, dap1b-/-, and transgenic dap-/-, dap1b-/- expressing Dap or Dap1b (WT, 1 hpf: n = 18; dap-/-, dap1b-/-: n = 19; dap-/-, dap1b-/-, daptg: n = 7; dap-/-, dap1b-/-, dap1btg: n = 10; WT, 2 hpf: n = 21; WT, 3 hpf: n = 5). g, Scheme of the percentage of WT and dap-/-, dap1b-/-, habp4-/- (triple KO) embryos that developed into larvae (Extended Data Fig. 8g-j). h, Quantification of monosomes and polysomes from 1 hpf embryos (n = 6 per genotype; representative profile in Supplementary Fig. 1j). i-j, Quantification of protein synthesis rates normalized to Rpl3 (i) or alpha-Tubulin (j) (n = 6 per genotype; Supplementary Fig. 1l; for uncropped images of membranes see Supplementary Fig. 2c). For a, c, f and h-j, n are biologically independent samples. In a, c, d, f and h-j, data are scatter dot plots with mean ± standard deviation (SD); ns, not significant. Statistical analysis was performed with Kruskal-Wallis followed by Dunn’s two-sided tests (a, f), two-sided Mann-Whitney (c, d, h), and one-way ANOVA followed by one-sided Tukey’s multiple comparisons test (i, j). |