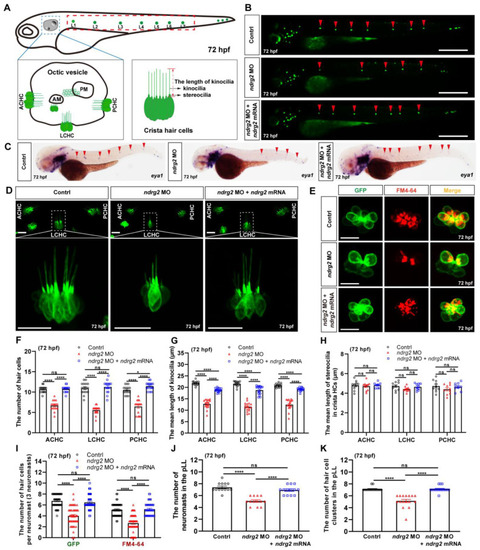
Knockdown of the ndrg2 gene led to significantly reduced crista hair cells (HCs), shortened kinocilia, decreased neuromasts as well as reductive functional HCs. (A) Schematic structure of main auditory organs in zebrafish (Danio rerio) at 72 hpf, including otic vesicle and posterior lateral line (pLL) system. Detailed structures of both otic vesicle and crista HCs cluster were depicted and the typical three clusters of crista HCs comprised anterior crista hair cell (ACHC), lateral crista hair cell (LCHC) and posterior crista hair cell (PCHC). The neuromasts in pLL that were analyzed in this study were marked with red dashed box. (B) Representative fluorescence images of HC clusters (marked with red arrowheads) in pLL at 72 hpf in the control, ndrg2 morphants, and ndrg2 mRNA rescued groups, respectively. Scale bars: 500 µm. (C) Lateral views of eya1 mRNA expression detected via whole-mount in situ hybridization (WISH) in normal, ndrg2 morphants, and ndrg2 mRNA rescued larvae at 72 hpf. The positive signals in neuromasts in the pLL were pointed with red arrowheads. (D) Representative fluorescence images of the three clusters of crista HCs at 72 hpf in control, ndrg2 morphants, and ndrg2 mRNA rescued groups, respectively. The details of LCHC (marked with white dashed box) were enlarged in corresponding groups. Scale bars: 20 µm. (E) Representative enlarged micrographs of HC cluster (green color) and functional HC cluster (red color) in single neuromast in pLL at 72 hpf in control, ndrg2 morphants, and ndrg2 mRNA rescued groups, respectively. Scale bars: 10 µm. (F–H) Statistical analysis of the number of crista HCs, the mean length of kinocilia and stereocilia at 72 hpf in the control, ndrg2 morphants, and ndrg2 mRNA rescued groups, respectively ((F,G) n = 16; (H), n = 10). (I) Statistical analysis of the number of HCs and functional HCs per neuromast at 72 hpf in control, ndrg2 morphants, and ndrg2 mRNA rescued groups, respectively (n = 48). (J,K) Statistical analysis of the number of HC clusters and neuromasts in pLL in control, ndrg2 morphants, and ndrg2 mRNA rescued groups, respectively ((I), n = 16; (J), n = 13). Symbols of * and **** above bars represent p < 0.05 and p < 0.0001, respectively. ns, no significance.
|
