
FIGURE
Fig. 11
Fig. 11
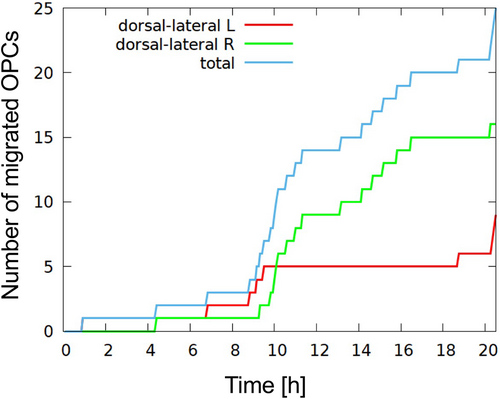
Number of ventral to dorsal migrated OPCs during the long-term measurement. Only about half as many migration events were detected in the left area as in the right. Since the left side was further away from the detection objective, the image quality was lower in this area and it was more difficult to make out individual cells.
|
Expression Data
Expression Detail
Antibody Labeling
Phenotype Data
Phenotype Detail
Acknowledgments
This image is the copyrighted work of the attributed author or publisher, and
ZFIN has permission only to display this image to its users.
Additional permissions should be obtained from the applicable author or publisher of the image.
Full text @ Microsc. Res. Tech.