
FIGURE
Fig. 9
Fig. 9
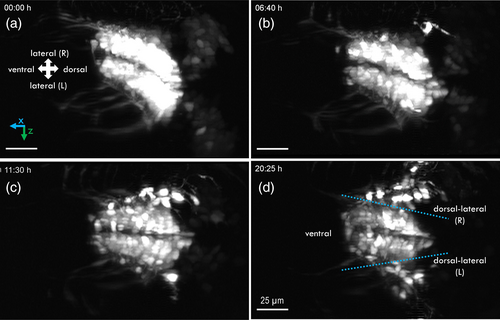
MIPs along z-direction in the spinal cord of a two-day-old Tg(olig2:eGFP) zfl. The blue dashed line separates the dorsal from the ventral area (main cords). (a) t = 0 h, (b) t = 6:40 h, (c) t = 11:30 h, and (d) t = 20:25 h. the image areas indicated by yellow frames are shown magnified and at higher time resolution in Figures 12 and 13. See also Movie S1. Image brightness and contrast were increased for visualization without applying a gamma correction in order to pronounce the fine image details. The recorded raw images were far from being oversaturated.
|
Expression Data
Expression Detail
Antibody Labeling
Phenotype Data
Phenotype Detail
Acknowledgments
This image is the copyrighted work of the attributed author or publisher, and
ZFIN has permission only to display this image to its users.
Additional permissions should be obtained from the applicable author or publisher of the image.
Full text @ Microsc. Res. Tech.