FIGURE

Fig. 3

ID
ZDB-FIG-230625-31
Publication
Samimi et al., 2023 - Light-sheet autofluorescence lifetime imaging with a single-photon avalanche diode array
Other Figures
All Figure Page
Back to All Figure Page
Fig. 3

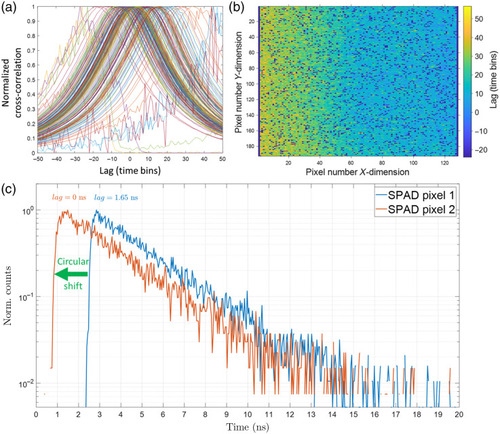
FLIMera SPAD array camera inter-pixel delay map. To compensate for the inter-pixel timing skew and synchronize the rise time of all 192×128  pixels, the normalized cross-correlation of the measured decay for each pixel with a reference decay was calculated. (a) These cross-correlation curves for a representative group of SPAD pixels (each curve is one pixel). The temporal lag value where the normalized cross-correlation is maximized was recorded and mapped as seen in (b) for every pixel of the SPAD array. The “screamer” dead pixels are dark blue and comprise 15% of all pixels. The inter-pixel lag between pixels on the left and right side of the sensor can be as high as 60 time bins (with 41.1 ps time bin width) or 2.5  ns, which is substantial. To synchronize the rise time of all pixels, it suffices to apply an opposite circular shift to the decay histogram of each SPAD pixel by the amount given by the delay map above. (c) The decays from two representative SPAD pixels that have different timing lags. SPAD pixel 1 has a lag of 40 time bins or 1.65 ns with respect to the reference decay, whereas SPAD pixel 2 has a lag of zero. To correct the timing skew, the blue curve should be shifted to the left by 40 time bins.

Expression Data

Expression Detail
Antibody Labeling
Phenotype Data

Phenotype Detail
Acknowledgments
This image is the copyrighted work of the attributed author or publisher, and ZFIN has permission only to display this image to its users. Additional permissions should be obtained from the applicable author or publisher of the image. Full text @ J. Biomed. Opt.