|
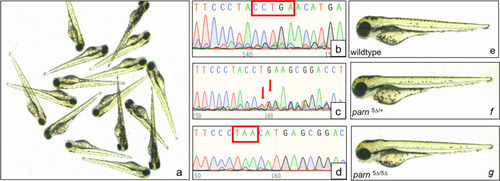
(a) Representative images of embryos obtained from a parn heterozygous cross at day 3. (b–d) shows the electropherogram of wildtype, heterozygous (parn5∆/+) and homozygous (parn5∆/5∆) mutant embryos respectively. The region highlighted in ‘b’ shows 5 bases ‘CCTGA’ intact in wildtype. In ‘c’ the arrows represent the rearrangement of bases due to loss of 5 bases ‘CCTGA’ in one allele. The highlighted region in ‘d’ shows the stop codon (TAA) that arises due to loss of 5 bases ‘CCTGA’ in both the allele. (e), (f), (g) corresponds to embryos at day 3 for wildtype, heterozygous and homozygous mutant respectively with no morphological difference. All images were captured using Leica S9D, Camera MC190. Polypeak parser (yosttools.genetics.utah.edu/PolyPeakParser/) software was used to analyse the sequencing data.
|