IMAGE

Figure 3

ID
ZDB-IMAGE-230622-11
Source
Figures for Nanjappa et al., 2023
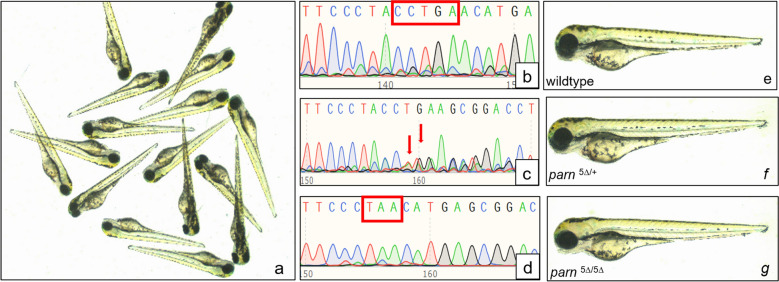
Image
Figure Caption

Figure 3

(a) Representative images of embryos obtained from a parn heterozygous cross at day 3. (bd) shows the electropherogram of wildtype, heterozygous (parn5∆/+) and homozygous (parn5∆/5∆) mutant embryos respectively. The region highlighted in ‘b’ shows 5 bases ‘CCTGA’ intact in wildtype. In ‘c’ the arrows represent the rearrangement of bases due to loss of 5 bases ‘CCTGA’ in one allele. The highlighted region in ‘d’ shows the stop codon (TAA) that arises due to loss of 5 bases ‘CCTGA’ in both the allele. (e), (f), (g) corresponds to embryos at day 3 for wildtype, heterozygous and homozygous mutant respectively with no morphological difference. All images were captured using Leica S9D, Camera MC190. Polypeak parser (yosttools.genetics.utah.edu/PolyPeakParser/) software was used to analyse the sequencing data.

Acknowledgments
This image is the copyrighted work of the attributed author or publisher, and ZFIN has permission only to display this image to its users. Additional permissions should be obtained from the applicable author or publisher of the image. Full text @ Sci. Rep.