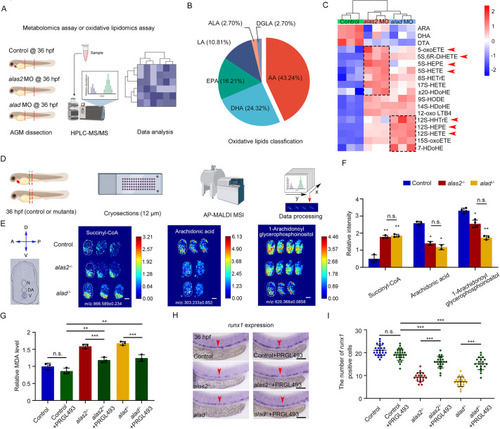
Iron-mediated AA oxidation leads to overproduction of 5S- and 12S-related ferroptotic stimulus. (A) Schematic workflow for the metabolomics analyses using the dissected trunk region of control, alas2- and alad-morphants at 36 hpf. (B) Pie-chart of the proportion of each lipid species in total oxidative lipids. AA, arachidonic acid; ALA, α-linoleic acid; DGLA, dihomo-γ- linoleic acid; DHA, docosahexaenoic acid; EPA, eicosapentaenoic acid; LA, linoleic acid. (C) Heatmaps of differentially regulated oxidative lipids in alas2 and alad morphants. 5S- and 12S-related oxidative lipids are denoted by red arrowheads. (D) Schematic workflow for the MALDI-MSI experiment using control, alas2−/− and alad−/− at 36 hpf. Cross-cryosections of AGM region are collected (denoted by red dashed rectangle). (E) High resolution MALDI-MS images of succinyl-CoA, AA and 1-arachidonoyl glycerophosphoinositol in control, alas2−/− and alad−/− at 36 hpf. Left panel is the navigator for cross-section. Relative abundance (mass spectrum peak intensity) of each metabolite is labeled as per the color bars. (F) Statistical analyses of the relative abundance of succinyl-CoA, AA and 1-arachidonoyl glycerophosphoinositol in the VDA regions in H. n=2-4 experimental replicates. (G) Relative MDA content in control, alas2−/− and alad−/− with or without PRGL493 treatment at 36 hpf. PRGL493 treatment from 26 to 36 hpf. n=3 experimental replicates. (H) Expression of the HSPC marker runx1 in control, alas2−/− and alad−/− with or without PRGL493 treatment at 36 hpf examined by WISH. The AGM regions for marker gene-positive cell counting are denoted by red arrowheads. (I) Quantification of the runx1-positive HSPCs in H. n=3 experimental replicates. Number of samples are indicated. Data are mean±s.d. *P<0.05, **P<0.01, ***P<0.001 (one-way ANOVA, Tukey's multiple comparisons). n.s., not significant. Scale bars: 100 μm.
|
