|
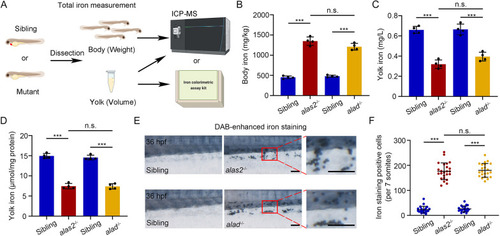
Heme-deficient primitive RBCs display iron accumulation. (A) Workflow of iron distribution assay of body and corresponding yolk regions by ICP-MS or iron colorimetric assay kit, respectively, in alas2−/−, alad−/− and their siblings at 36 hpf. (B-D) Quantification of the total iron level of dissected body (B) and yolk (C,D). The body and yolk sac iron content are quantified as weight (mg/kg) and volume (mg/l or μmol/mg protein), respectively. n=4 experimental replicates. (E) Representative bright-field images of DAB-enhanced iron staining in alas2−/−, alad−/− and their siblings at 36 hpf. Right column shows magnification of areas in red box showing iron enriched RBCs in caudal hematopoietic tissue (CHT) circulation. (F) Quantification of the iron staining-positive RBCs in E. n=3 experimental replicates. Number of samples are indicated. Data are mean±s.d. ***P<0.001 (one-way ANOVA, Tukey's multiple comparisons). n.s., not significant. Scale bars: 100 μm.
|