
Fig. 5
- ID
- ZDB-FIG-230612-11
- Publication
- Hodorovich et al., 2023 - Morphological and sensorimotor phenotypes in a zebrafish CHARGE syndrome model are domain-dependent
- Other Figures
- All Figure Page
- Back to All Figure Page
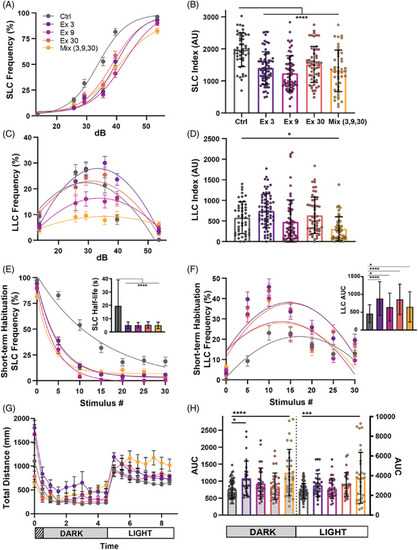
CRISPR guides targeting different chd7 Exons induce varying phenotypes. (A) Acoustic startle responses, average short‐latency c‐bend (SLC) frequency as acoustic stimulus intensity increases (Control n = 47, Exon 3 n = 66, Exon 9 n = 60, Exon 30 n = 54, Mix n = 45) (mean ± SEM). (B) Short‐latency c‐bend sensitivity index, calculated by the area under the SLC frequency curves for individual larvae (mean ± SD, Ordinary one‐way ANOVA with Dunnett's multiple comparisons). (C) Long‐latency c‐bend (LLC) frequency as acoustic stimulus intensity increases (mean ± SEM). (D) Long‐latency c‐bend sensitivity index calculated by the area under the LLC frequency curves for individual larvae (mean ± SD, Ordinary one‐way ANOVA with Dunnett's multiple comparisons). (E) Short‐term habituation, average SLC frequency (Control n = 48, Exon 3 n = 61, Exon 9 n = 59, Exon 30 n = 57, Mix n = 49) (mean ± SEM) during 30 acoustic stimuli at highest intensity with (inset) SLC half‐life calculated by nonlinear regression (one‐phase exponential decay) of SLC frequency curves for individual larvae (mean ± SD, Ordinary one‐way ANOVA with Dunnett's multiple comparisons). (F) Average LLC frequency (mean ± SEM) during 30 acoustic stimuli at highest intensity with (inset) LLC sensitivity index calculated by the area under the LLC frequency curves for individual larvae (mean ± SD, Ordinary one‐way ANOVA with Dunnett's multiple comparisons). (G) Average total distance traveled plot during 9 h of recording, analyzed every 30 min, including 1 h of acclimation, 4 h in the dark, and 4 h in light (Control n = 54, Exon 3 n = 27, Exon 9 n = 30, Exon 30 n = 31, Mix n = 31) (mean ± SEM). (H) Area under the curve for individual larvae distance plots during the dark or light phase (mean ± SD, Ordinary one‐way ANOVA with Dunnett's multiple comparisons, *p < 0.05, ***p < 0.001,****p < 0.000). |