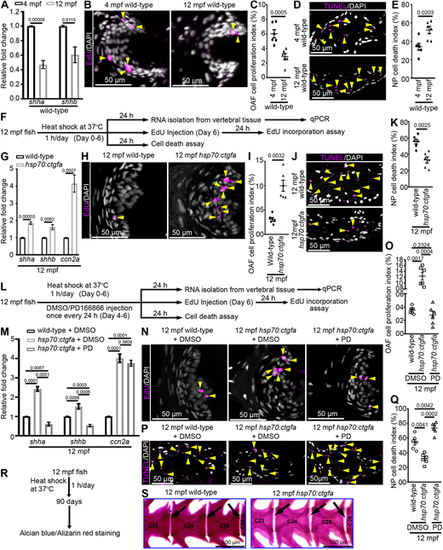
Ccn2a induces regeneration in aged IVDs by inducing FGFR1 signaling. (A) qPCR analysis of shha and shhb expression in vertebral tissues (n=4). (B) Maximum intensity projections (MIPs) of confocal images of sagittal IVD sections stained for EdU (magenta; proliferating cells) and nuclei (white). Arrowheads indicate EdU+ cells in the OAF. (C) Quantification of proliferating OAF cells (n=6 each). (D) MIPs of confocal images of sagittal IVD sections stained for TUNEL (magenta; dead cells) and nuclei (white). Arrowheads indicate TUNEL+ cells in the NP. (E) Quantification of NP cell death (n=6). (F) Schematic of experimental procedures. (G) qPCR analysis of shha, shhb and ccn2a expression in vertebral tissues (n=4). (H) MIPs of confocal images of sagittal IVD sections stained for EdU (magenta; proliferating cells) and nuclei (white). Arrowheads indicate EdU+ cells in the OAF. (I) Quantification of proliferating OAF cells (n=6). (J) MIPs of confocal images of sagittal IVD sections stained for TUNEL (magenta; dead cells) and nuclei (white). Arrowheads indicate TUNEL+ cells in the NP. (K) Quantification of NP cell death (n=6). (L) Schematic of experimental procedures. (M) qPCR analysis of shha, shhb and ccn2a expression in vertebral tissues (n=4). (N) MIPs of confocal images of sagittal IVD sections stained for EdU (magenta; proliferating cells) and nuclei (white). Arrowheads indicate EdU+ cells in the OAF. (O) Quantification of proliferating OAF cells (n=6). (P) MIPs of confocal images of sagittal IVD sections stained for TUNEL (magenta; dead cells) and nuclei (white). Arrowheads indicate TUNEL+ cells in the NP. (Q) Quantification of NP cell death (n=6). (R) Schematic of experimental procedures. (S) Bright-field lateral views of AB/AR-stained zebrafish. Black arrows indicate intervertebral spaces. In A,C,E,G,I,K,M,O,Q, data are mean±s.e.m.; each sample represents one animal. PD, PD166866. Mean Ct values can be found in Table S5.
|
