
FIGURE
Fig. 5
- ID
- ZDB-FIG-230515-13
- Publication
- Calderon-Garcia et al., 2022 - Exposure to Morphine and Cocaine Modify the Transcriptomic Landscape in Zebrafish Embryos
- Other Figures
- All Figure Page
- Back to All Figure Page
Fig. 5
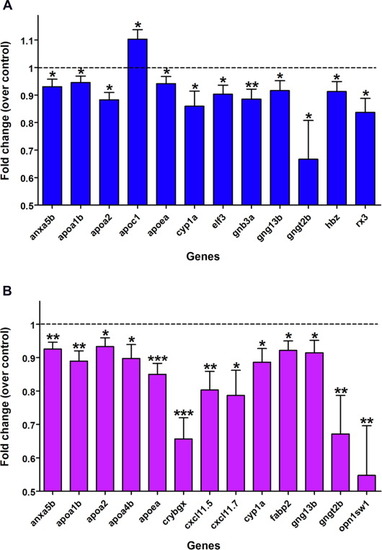
Fig. 5. Qpcr results of selected genes from the rnaseq assay. expression levels were compared between control embryos of 72hpf and exposed to (A) 10 μM morphine or (B) 15 μM cocaine. Data represent the mean ± SEM of at least seven independent assays performed in triplicate. Results have been analyzed with one-way ANOVA (control, morphine, and cocaine treatment), followed by a Tukey post-test. Legend: *p-value < 0.05; **p-value < 0.01; ***p-value < 0.001. |
Expression Data
Expression Detail
Antibody Labeling
Phenotype Data
Phenotype Detail
Acknowledgments
This image is the copyrighted work of the attributed author or publisher, and
ZFIN has permission only to display this image to its users.
Additional permissions should be obtained from the applicable author or publisher of the image.
Full text @ Neuroscience