
FIGURE
Fig. 4
- ID
- ZDB-FIG-230515-12
- Publication
- Calderon-Garcia et al., 2022 - Exposure to Morphine and Cocaine Modify the Transcriptomic Landscape in Zebrafish Embryos
- Other Figures
- All Figure Page
- Back to All Figure Page
Fig. 4
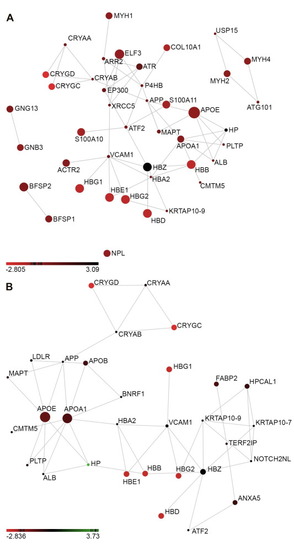
Fig. 4. Network analysis of deregulated genes identified in the transcriptomic analysis for (A) morphine and (B) cocaine. APID software was used to determine the functional interactions, and visualization of the results was performed with RJSplot software. The color and the size of the nodes represent the changes in the gene expression level between the control and treated groups. |
Expression Data
Expression Detail
Antibody Labeling
Phenotype Data
Phenotype Detail
Acknowledgments
This image is the copyrighted work of the attributed author or publisher, and
ZFIN has permission only to display this image to its users.
Additional permissions should be obtained from the applicable author or publisher of the image.
Full text @ Neuroscience