
Fig. 1
- ID
- ZDB-FIG-230515-103
- Publication
- Potts et al., 2022 - Splicing factor deficits render hematopoietic stem and progenitor cells sensitive to STAT3 inhibition
- Other Figures
- All Figure Page
- Back to All Figure Page
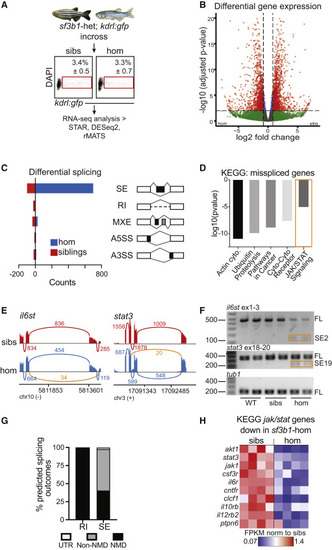
Stat3 pathway components are differentially spliced and expressed in sf3b1 mutant zebrafish cells (A) Experimental setup for zebrafish RNA sequencing. kdrl:gfp+ endothelial cells were FACS-isolated from 24 h post fertilization (hpf) embryos (sf3b1 homozygous mutants [hom] and siblings [sibs]). (B) Volcano plot of differentially expressed genes from RNA-seq analysis comparing sf3b1 homozygous mutants and siblings. Significance thresholds imposed at adjusted p < 0.01 and log2 fold change > |0.8|. (C) Quantification of differential splicing events between sf3b1 homozygous mutants and siblings, separated by type of splicing event. SE, cassette (skipped) exon; RI, retained intron; MXE, mutually exclusive exon; A5SS, alternative 5′ splice site; A3SS, alternative 3′ splice site. Events were considered significant if FDR < 0.05 and inclusion difference > |0.1|. (D) KEGG pathway analysis of alternatively spliced genes identified in RNA-seq analysis of zebrafish sf3b1 homozygous mutants versus siblings. Cyto, cytokine. (E) Sashimi plots showing exon-skipping events identified in il6st (exon 3) and stat3 (exon 19), derived from rMATS analysis of RNA-seq data of endothelial cells from sf3b1 homozygotes (blue) versus siblings (red) at 24 hpf. Alternative splicing event identified in homozygotes indicated (orange). Numbers on plots depict average number of reads across replicates supporting the event. (F) RT-PCR for il6st (top) and stat3 (middle) splice isoforms and tubulin (tub1) control (bottom) from purified endothelial cells from 24 hpf WT, siblings, and homozygous sf3b1 mutant embryos. SE2, il6st ex2 skipped exon isoform; SE19, stat3 ex19 skipped exon isoform; FL, full-length isoform, including upstream, downstream, and skipped exons; tub1, tubulin control. Representative gel images of n = 3 experiments. (G) Graph depicting the percentage of alternatively spliced isoforms (RI, retained introns; SE, skipped exons) in sf3b1 mutants that are predicted to result in nonsense-mediated (NMD) decay, protein sequence alterations (non-NMD), or changes in untranslated regions (UTR). (H) Expression levels of Jak/Stat pathway components and target genes in sf3b1 homozygotes (right) versus siblings (left) from RNA-seq analysis. FPKM, fragments per kilobase per million mapped reads. Each heatmap column represents a separate biological replicate. See also Figure S1. |