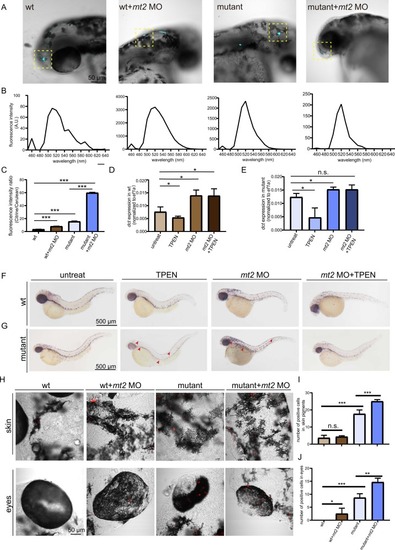
Free zinc detection, pigment formation and proliferation analysis in embryos with different treatments. A, Representative images showing the fluorescent expression of the Zn2+ sensor in melanocytes in embryos with different treatments. B, Emission spectra of the Zn2+ sensor in melanocytes of embryos with different treatments. C, The emission ratio of citrine (∼520 nm) over cerulean (∼460 nm) as a function of Zn2+ concentration. D-E, The expression level of dct in wild-type (D) and slc30a1 mutants (E) with different treatments detected by qPCR. F-G, Whole-mount in situ hybridization of dct in wild-type (F) and mutant embryos (G) with different treatments from 24 h to 48 hpf. Embryos were collected at 48 hpf. Increased dct staining is indicated by red arrows. H, Representative images of PH3 immunostaining of wild-type and slc30a1 mutant embryos with different treatments at 48 hpf. I, Summary of PH3-positive cells in the back skin of wild-type and mutant embryos. J, Summary of PH3-positive cells in the eyes of wild-type and mutant embryos.*p < 0.05, **p < 0.01, ***p < 0.001 and n.s., not significant. (For interpretation of the references to colour in this figure legend, the reader is referred to the web version of this article.)
|
