
Fig. 9
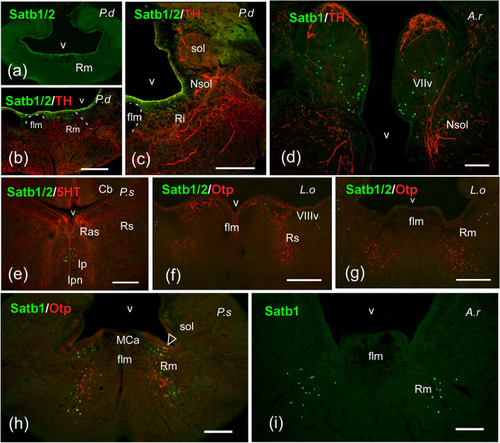
Photomicrographs of transverse single- and double-labeled sections through rhombencephalic areas of Protopterus dolloi (P.d), Acipenser ruthenus (A.r), Polypterus senegalus (P.s), and Lepisosteus oculatus (L.o) showing the location of SATB1/2 or SATB1 (green color) alone or in combination with TH, 5-HT or Otp (red color) immunoreactivity. The markers and the species are indicated in each image. a–c SATB1/2-ir cells in the reticular formation of P. dolloi. d Population of SATB1-ir cells in the facial lobe and solitary tract nucleus of A. ruthenus. e SATB1/2-ir cells in the interpeduncular nucleus of P. senegalus. f, g Populations of SATB1/2-ir cells in the ventral octavolateral area (f) and the median reticular nucleus (g) of L. oculatus. h, i Reticular cells labeled with SATB1 in P. senegalus (h) and A. ruthenus (i); arrowheads in (h) point to double labeled cells. For abbreviations, see list. Scale bars = 200 µm (c), 100 µm (a, b, d, e), 50 µm (f) |