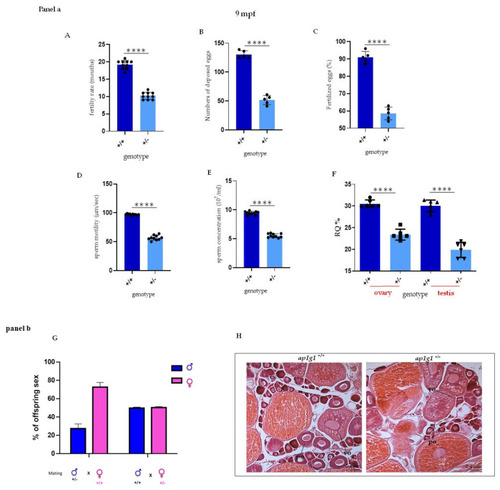
Fertility analysis in heterozygous ap1g1+/− fish. Panel a (A) The graph represents the fertility rate of heterozygous compared to +/+ females. The data are representative of five different experiments with 10 fish per group (B,C) The graphs show respectively the number of laid eggs and fertilized eggs in +/+ and +/− females at 9-mouths-old fish obtained by three different experiments; the observed female was 12 for each group. Concentration (D), velocity (E) and viability (F) of ejaculated sperm. Depicted is mean ± SEM. **** p < 0.0001; n = 10, in triplicate. Motility (D) and concentration (E) of ejaculated sperm from 1-year-old fish. Experiment was done twice. Motility: n = 10 +/+ mean = 97.20 and n = 10 +/− mean = 56.80; concentration: n = 7 +/+ mean = 9.46 × 10⁷/mL and n = 7 +/− mean = 5.54 × 10⁷/mL. (F) qPCR analysis on +/+ and +/− fish respectively in ovary and testis. The experiment was repeated twice. n = 10 for each column. Panel b (G) The graph represents the percentage of different offspring obtained by matings between ap1g1+/− male and ap1g1+/+ female and ap1g1+/+ male with ap1g1+/− female. (H) Histological analysis of ap1g1+/+ and ap1g1+/− ovary detects oocyte maturation defects in mutant females; black arrowheads indicate debris of atretic follicles. Abbreviations: po primary oocyte, vo vitellogenic oocyte.