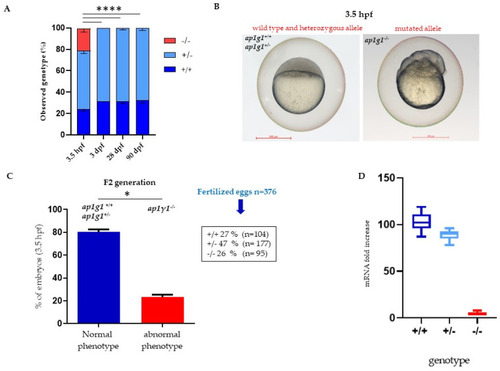
Characterization of ap1g1 mutant embryos and larvae. (A) Representative images of genotype distribution at different developmental stages. Data derived from five different matings with n = 100 in each mating. For genotyping see Math and Met Section. (B) Comparison of the morphological phenotype of embryos derived from F2 generation (F1 ap1g1+/− × F1 ap1g1+/−) at 3.5 hpf. (C) In the graph blue bar indicates the percentage (%) of embryos with +/+ and +/− genotype and normal phenotype, the red bar indicates the embryos with −/− genotype and abnormal phenotype. The data represent one experiment out of three with n = 376 embryos. (* p < 0.05, **** p < 0.0001 One-way ANOVA + Newman-Keuls). Size bar = 500 μm; (D) qPCR analysis of ap1g1 transcript from ap1g1+/+; ap1g1+/− and ap1g1−/− embryos at 24 hpf. Gene expression was normalized using rpl13a as a reference gene and expressed as the mRNA fold increased.