
Fig 3
- ID
- ZDB-FIG-230420-35
- Publication
- Eeza et al., 2023 - Probing microstructural changes in muscles of leptin-deficient zebrafish by non-invasive ex-vivo magnetic resonance microimaging
- Other Figures
- All Figure Page
- Back to All Figure Page
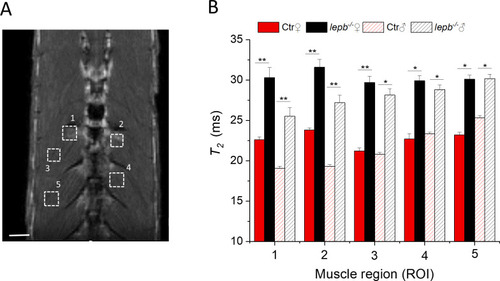
T2 relaxation time measurements in various muscle regions of control (Ctr) and lepb-deficient (lepb-/-) adult zebrafish.
(A) Anatomical T2 –weighted MR coronal slices of an adult zebrafish, showing various muscle regions for T2 measurements. Scale bar, 500 μm. (B) T2 relaxation time values were measured in five different muscle regions of female (♀) and male (♂) control (Ctr) and leptin-deficient (lepb-/-) zebrafish. The reliability test of T2 measurements was performed by Bonferroni test using a 1-way analysis of variance (ANOVA) to accomplish pairwise comparisons of the data. At the 0.05 level, the T2 population means of lepb-/- and Ctr are significantly different for both male and female zebrafish. Data represent the mean T2 in ms ± standard deviation (SD) (Error bars) (95% C.I.); n = 6 per group; *p<0.05, **p<0.01. |