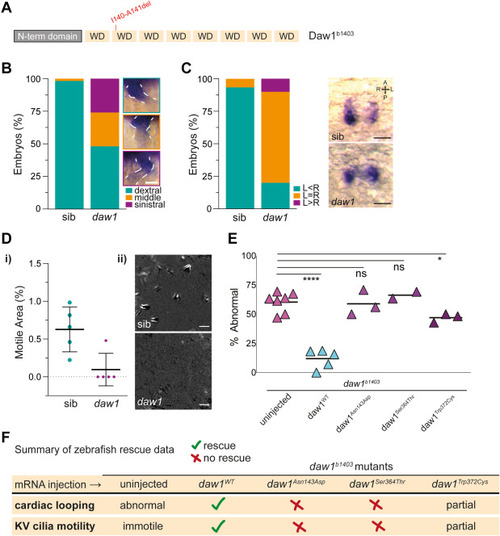
Figure 2. In vivo modeling of DAW1 variants using zebrafish mutant. A. Schematic of zebrafish Daw1 protein showing the location of the 2 amino acid deletion present in daw1b1403 mutants. B. Quantitation of cardiac looping phenotypes with representative images in daw1b1403 mutants (n = 54) and sibling controls (n = 118). Scale bar: 50 μm. C. Quantitation of dand5 expression with representative images in daw1b1403 mutants (n = 30) and sibling controls (n = 30). Scale bars: 50 μm. Di. Quantitation of the area occupied by motile cilia in KV at the 10-somite stage. Each data point represents a distinct embryo. Dii. Representative temporal image correlation spectroscopy images of KV cilia motility where white/gray pixels show regions of periodic motion. Scale bars: 5 μm. E. Dot plot showing the percentage of daw1b1403 mutant embryos exhibiting abnormal cardiac looping laterality after injections with mRNA encoding either wild-type or variant Daw1. ∗P < .05; ∗∗∗∗P < .001; ns, not significant; unpaired t test was applied. F. Summary table of zebrafish rescue assay data. KV, Kupffer’s vesicle; mRNA, messenger RNA; ns, not significant; sib, sibling control.
|
