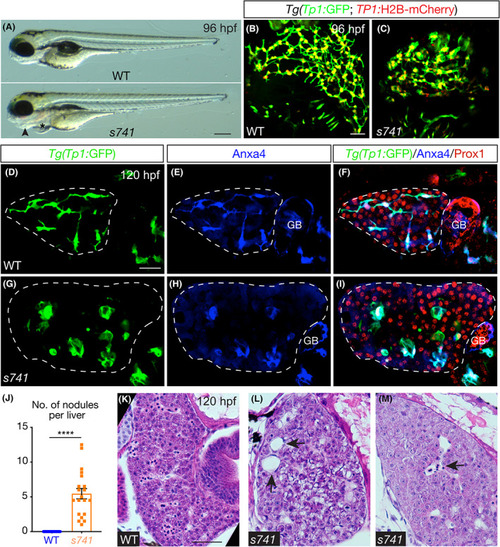
s741 mutants develop hepatic nodules composed of intrahepatic biliary cells. (A) Live wild‐type (WT; top) and s741 mutant (bottom) larvae at 96 h pst fertilization (hpf). Lateral views; anterior is on the left. Arrowhead points to the degenerating pharyngeal arches and asterisk marks the pericardial edema. (B,C) Confocal three‐dimensional (3D) projections of larvae expressing Tg(Tp1:GFP [green fluorescent protein]) (green) and Tg(Tp1:H2B‐mCherry) (red) transgenes in the intrahepatic biliary cells. (D–I) Confocal single‐plane images of the livers. (D,G) Tg(Tp1:GFP) transgene expression marks the intrahepatic biliary cells. (E,H) Annexin A4 (Anxa4) antibody stains the biliary cells.[ 50 ] (F,I) Merged images. Prox1 antibody labels the nuclei of hepatocytes and biliary cells. (B–I) Ventral views; anterior is to the top. (J) Numbers of Tg(Tp1:GFP)+ nodules (mean ± SEM) in the liver of WT (blue) and s741 mutant (orange) larvae at 96 hpf. A nodule was defined as a cluster of two or more Tg(Tp1:GFP)+ cells that maintained one or no interconnecting ducts with other biliary cells. Each dot represents individual liver. Statistical significance was calculated by two‐tailed Student's t test: ****p < 0.0001. (K–M) Hematoxylin and eosin stain of larval livers. Arrows in (L) point to cystic spaces that are entirely surrounded by hepatocytes and/or cholangiocytes. Arrow in (M) marks a cystic space that is lined by endothelium and contains red blood cells. Scale bars: 70 μm (A); 30 μm (B–I); and 50 μm (K–M). For experiments in (A)–(I) and (K)–(M), 10 WT and 10 mutants were examined and all of them exhibited the representative phenotypes. GB, gallbladder.