
Figure 6
- ID
- ZDB-FIG-230323-5
- Publication
- Zylbertal et al., 2023 - Recurrent network interactions explain tectal response variability and experience-dependent behavior
- Other Figures
- All Figure Page
- Back to All Figure Page
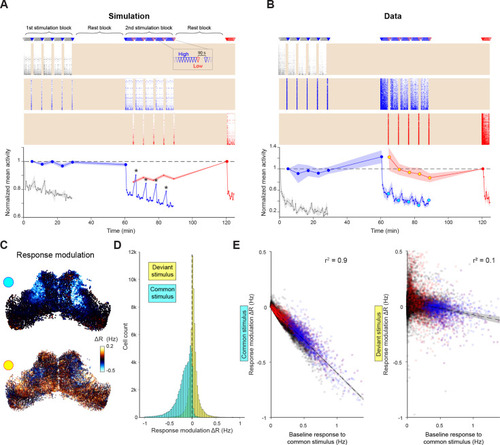
(A–B) Simulated (A) and recorded (B) responses of cells tuned to very low (grey), high (blue) and low (red) elevation stimuli. Top: Stimulation protocol. Middle: Raster of responses of individual cells (activity in inter-stimulus periods is excluded, shading). Bottom: Mean response across cells tuned to each elevation, normalised by first response. Large symbols indicate epochs used to establish the `baseline` response for analysis in (C-E), stars indicate partial response recovery following 90 s breaks. Shaded areas indicate SEM for n=5 fish or simulation runs. (C) Top: Response modulation for the high elevation stimulus. For every OT cell, we compare the baseline response (large blue circles in (B)) to the 2nd stimulation block (cyan circles in B) where the stimulus is presented as a common stimulus. Bottom: Response modulation for the low elevation stimulus, comparing baseline responses (large red circle in (B)) to the 2nd stimulation block (yellow circles in (B)) where it is presented as a deviant stimulus. (D) Distribution of single-cell response modulation for the common (cyan) and deviant stimulus (yellow), (n=67,750 cells from 5 fish). (E) Single cell response modulation for common (left) and deviant stimulus (right) as a function of the baseline response to the common stimulus. Blue and red spots indicate cells tuned to the common and deviant stimuli, respectively. Shaded areas indicate linear regression confidence intervals for α=10–10. See also Figure 6—figure supplement 1. |