
Figure 1—figure supplement 1.
- ID
- ZDB-FIG-230323-2
- Publication
- Zylbertal et al., 2023 - Recurrent network interactions explain tectal response variability and experience-dependent behavior
- Other Figures
- All Figure Page
- Back to All Figure Page
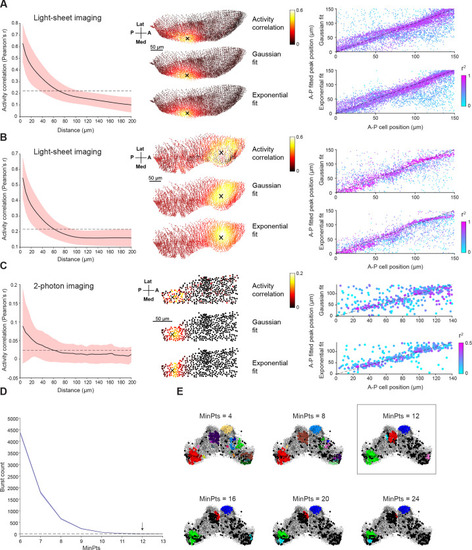
(A–B) Left: Pairwise activity correlation as a function of Euclidean distance between cells in two additional example fish (red shaded area denotes SD across cells, n=18,580 and 10,948). Middle: Example correlation maps alongside Gaussian and exponential fits for the same fish. Right: Positions of peaks of the fitted functions vs positions of seed cells. Spot colors indicate r2 values. (C) Same analysis as A-B but for two-photon imaging of single plane in OT of a third fish. (D) To select the MinPts parameter for DBSCAN, we performed a shuffle analysis in which the time base for each neuron was circularly permuted. Plot shows the mean number of detected bursts across 10 permutations as a function of the MinPts parameter. Shaded area indicates SD, arrow indicates the conservative value we chose, where zero bursts were detected in shuffled data. (E) Bursts detected for one tectal activity peak for different values of MinPts. Rectangle indicates chosen value. A, anterior; P, posterior; Med, medial; Lat, lateral. |