
Figure 1.
- ID
- ZDB-FIG-230321-1
- Publication
- Canham et al., 2023 - EVA1A (Eva-1 Homolog A) Promotes Endothelial Apoptosis and Inflammatory Activation Under Disturbed Flow Via Regulation of Autophagy
- Other Figures
- All Figure Page
- Back to All Figure Page
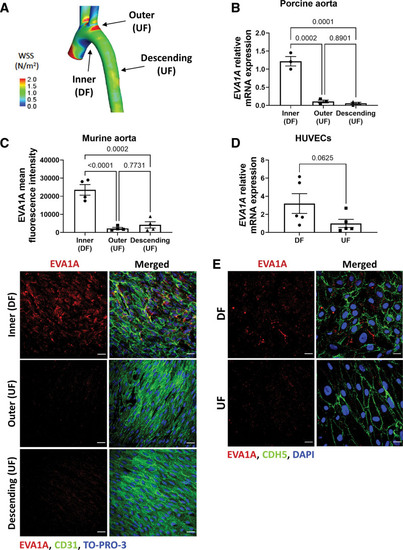
EVA1A (eva-1 homolog A) is induced by proatherogenic shear stress in pig, mouse, and human endothelial cells (ECs). A, Map of time-averaged wall shear stress in the porcine aorta. The regions of undisturbed flow (UF) and disturbed flow (DF) are indicated by arrows. Adapted from Serbanovic-Canic et al.32 B, ECs were isolated from the inner curvature of the porcine aortic arch (DF site), outer curvature of the aortic arch (UF site), and the descending aorta (UF site). The mRNA expression of EVA1A was quantified in each cell population by quantitative real-time polymerase chain reaction (qRT-PCR; n=3 pigs) and normalized to housekeeping gene B2M. C, Aortas were isolated from 8-wk-old C57BL/6 mice (n=4 mice) and en face immunostaining was performed using anti-EVA1A antibody (C, red) in the inner and outer curvature of the aortic arch and the descending aorta. The endothelium was stained with anti-CD31 antibody (C, green) and nuclei costained with TO-PRO-3 (C, blue). The analyzed data was from a minimum of 3 fields of view per animal per aortic location. The graph in C represents EVA1A mean fluorescence intensity (n=4 mice). D and E, Human umbilical vein EC (HUVECs) were cultured under flow for 72 h using the orbital shaker model. D, Cells were isolated from DF (center of the well) and UF (periphery of the well) regions and EVA1A mRNA expression levels were measured by qRT-PCR (n=5 donors). EVA1A expression was normalized to housekeeping gene HPRT. E, Protein levels and cellular localization of EVA1A were assessed by immunostaining using anti-EVA1A antibody (red), EC marker cadherin 5 (CDH5, green), and costaining of nuclei (DAPI [4′,6-diamidino-2-phenylindole], blue; n=3 donors). B, C, and D, Data are presented as means±SE of the mean. Differences between groups were analyzed using 1-way ANOVA with Tukey posthoc test (B and C) and Wilcoxon sum rank test (D). P values are shown in the graphs. Scale bar: (C), 40 µm; (D), 20 µm. |