
Fig. 1
- ID
- ZDB-FIG-230318-10
- Publication
- Miao et al., 2022 - The landscape of pioneer factor activity reveals the mechanisms of chromatin reprogramming and genome activation
- Other Figures
- All Figure Page
- Back to All Figure Page
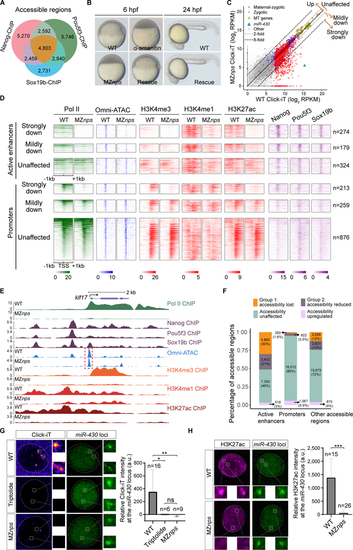
Nanog, Pou5f3, and Sox19b are required for chromatin remodeling and histone modification during ZGA.
(A) Venn diagram showing significant overlap of NPS binding at all accessible regions (P < 1×10−100 Fisher’s exact test). (B) Micrographs of zebrafish embryos. At 6 hpf, wild-type (WT) embryos develop to the shield stage, while MZnps embryos arrest at the sphere stage and resemble those treated with α-amanitin (a Pol II inhibitor). Co-injection of nanog and pou5f3 mRNAs (Rescue) rescues development of MZnps embryos at 6 hpf and 24 hpf. (C) Biplots comparing nascent transcriptomes of MZnps and WT embryos using Click-iT-seq. (D) Heatmaps showing NPS binding, Pol II binding, Omni-ATAC, and H3K4me1, H3K4me3, and H3K27ac levels at N/P/S-bound active enhancer and promoter regions of zygotic genes. Heatmaps are centered at TSSs (promoters) or Omni-ATAC peak summits (active enhancers). Regions are ranked by the average Pol II binding signal within 1kb of the TSS of associated zygotic genes in WT embryos. (E) Representative genome tracks of Pol II binding, NPS binding, accessibility (Omni-ATAC), and H3K4me1, H3K4me3, and H3K27ac levels in WT and MZnps embryos. The dashed box highlights the klf17 promoter, which remains accessible in MZnps embryos. (F) Stacked bar plot showing the percentage of differentially affected accessible chromatin regions in MZnps embryos compared to WT. (G-H) Left: Confocal imaging showing the miR-430 locus with nascent transcription using Click-iT imaging (G) or H3K27ac immunofluorescence (H) in WT and MZnps embryos. Right: quantification of signal at the miR-430 locus. miR-430 was labeled with dCas9-GFP and sgRNAs targeting the locus. Nuclei are outlined with a dashed line based on DAPI signal. Triptolide is a Pol II inhibitor. Scale bar: 5 μm. See also Figure S1. |