
- Title
-
The landscape of pioneer factor activity reveals the mechanisms of chromatin reprogramming and genome activation
- Authors
- Miao, L., Tang, Y., Bonneau, A.R., Chan, S.H., Kojima, M.L., Pownall, M.E., Vejnar, C.E., Gao, F., Krishnaswamy, S., Hendry, C.E., Giraldez, A.J.
- Source
- Full text @ Mol. Cell
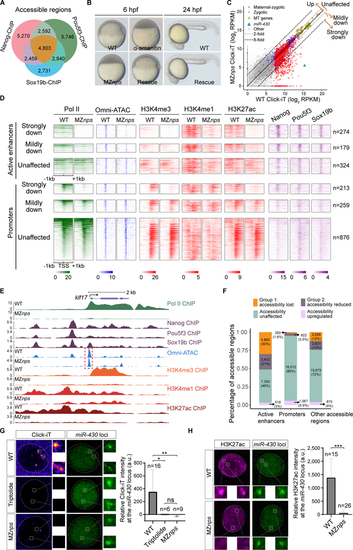
Nanog, Pou5f3, and Sox19b are required for chromatin remodeling and histone modification during ZGA.
(A) Venn diagram showing significant overlap of NPS binding at all accessible regions (P < 1×10−100 Fisher’s exact test). (B) Micrographs of zebrafish embryos. At 6 hpf, wild-type (WT) embryos develop to the shield stage, while MZnps embryos arrest at the sphere stage and resemble those treated with α-amanitin (a Pol II inhibitor). Co-injection of nanog and pou5f3 mRNAs (Rescue) rescues development of MZnps embryos at 6 hpf and 24 hpf. (C) Biplots comparing nascent transcriptomes of MZnps and WT embryos using Click-iT-seq. (D) Heatmaps showing NPS binding, Pol II binding, Omni-ATAC, and H3K4me1, H3K4me3, and H3K27ac levels at N/P/S-bound active enhancer and promoter regions of zygotic genes. Heatmaps are centered at TSSs (promoters) or Omni-ATAC peak summits (active enhancers). Regions are ranked by the average Pol II binding signal within 1kb of the TSS of associated zygotic genes in WT embryos. (E) Representative genome tracks of Pol II binding, NPS binding, accessibility (Omni-ATAC), and H3K4me1, H3K4me3, and H3K27ac levels in WT and MZnps embryos. The dashed box highlights the klf17 promoter, which remains accessible in MZnps embryos. (F) Stacked bar plot showing the percentage of differentially affected accessible chromatin regions in MZnps embryos compared to WT. (G-H) Left: Confocal imaging showing the miR-430 locus with nascent transcription using Click-iT imaging (G) or H3K27ac immunofluorescence (H) in WT and MZnps embryos. Right: quantification of signal at the miR-430 locus. miR-430 was labeled with dCas9-GFP and sgRNAs targeting the locus. Nuclei are outlined with a dashed line based on DAPI signal. Triptolide is a Pol II inhibitor. Scale bar: 5 μm. See also Figure S1. |
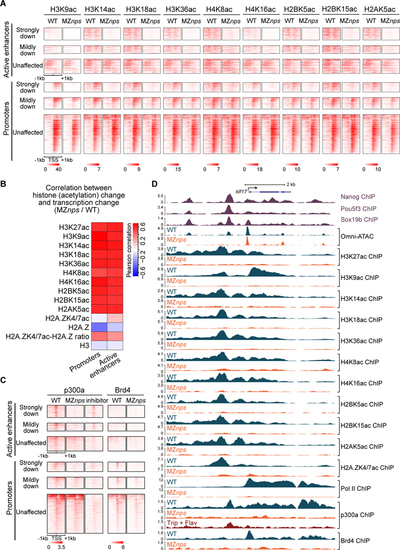
Nanog, Pou5f3, and Sox19b are required for histone acetylation across core histones and for recruitment of p300 and Brd4.
(A) Heatmaps showing histone acetylation levels across histones at N/P/S-bound active enhancers and promoters of differentially affected zygotic genes. Heatmaps are centered at TSSs (promoters) or Omni-ATAC peak summits (active enhancers) and ranked by Pol II binding intensity within 1kb of the TSS of the associated zygotic genes in wild-type (WT) embryos. (B) Heatmap showing the correlation between changes in transcription and changes in histone acetylation marks in MZnps/WT for N/P/S-bound active enhancers and promoters of zygotic genes. H2A.ZK4/7ac-H2A.Z ratio represents the ratio between H2A.ZK4/7ac and H2A.Z. (C) Heatmaps showing p300 and Brd4 levels at N/P/S-bound active enhancers and promoters of differentially affected zygotic genes. Heatmaps are centered and ranked as in (A). inhibitor: Pol II inhibitors (triptolide + flavopiridol). (D) Representative genome tracks of Pol II, p300, Brd4, and NPS binding, Omni-ATAC and histone acetylation across core histones in WT and MZnps embryos. See also Figure S2. |
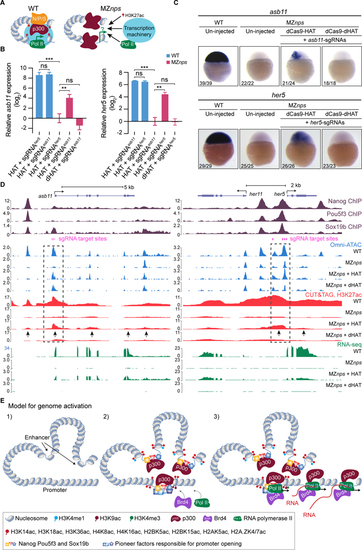
Histone acetyltransferase activity partially rescue transcription of NPS strong targets.
(A) Schematic for testing whether recruiting histone acetyltransferase activity can bypass NPS in activating transcription. (B) qPCR analysis showing the relative expression of asb11 and her5, normalized by actb1. When targeted, asb11 and her5 transcription was rescued by dCas9-HAT in MZnps embryos (two-tailed unpaired t-test, ns: not significant, ** P <0.01, *** P <0.001). sgRNAsasb11 injected embryos were used as a control for her5 expression analysis, and vice versa. sgRNAsasb11: sgRNAs targeting asb11. sgRNAsher5: sgRNAs targeting her5. (C) RNA in situ hybridization analysis of asb11 and her5 in wild-type (WT) and MZnps embryos. sgRNA targeting asb11 and her5 were injected separately. (D) Genome tracks showing that accessibility, H3K27ac, and transcription were restored at asb11 and her5 in MZnps embryos by the dCas9-HAT system. Transcription was activated for her11, a gene near her5. Dashed boxes highlight the sgRNA targeting regions. Arrows show regions where H3K27ac is rescued. sgRNA targeting asb11 and her5 were co-injected. (E) Model illustrating the sequence of events of NPS-mediated genome activation. See also Figure S3. |
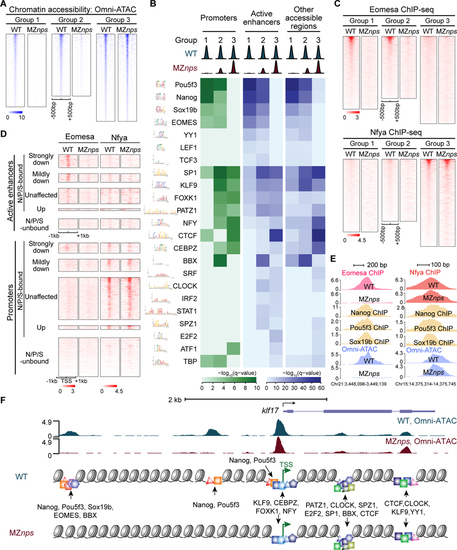
Identification of TF motifs enriched in accessible regions and their dependence on NPS.
(A) Heatmaps of Omni-ATAC signal at differentially affected accessible regions in wild-type (WT) and MZnps embryos. Heatmaps are centered at Omni-ATAC peak summits and ranked by the average Omni-ATAC signal intensity in WT. (B) Enrichment of representative TF motifs at promoters, active enhancers, and other accessible regions within the three groups of accessible regions from (A). (C) Heatmaps of Eomesa and Nfya ChIP-seq signal within the three groups of accessible regions from (A) in WT and MZnps embryos. Heatmaps are centered at the Omni-ATAC peak summits and ranked by average ChIP-seq signal in WT embryos. (D) Heatmaps showing Eomesa and Nfya levels at active enhancers and promoters of differentially affected zygotic genes. Heatmaps are centered at the TSS (promoters) and the summit of the Omni-ATAC peak (active enhancers) and ranked by average Pol II signal within 1kb of the TSS of the associated zygotic genes in WT embryos. (E) Representative genome tracks of TF binding and Omni-ATAC show that Eomesa binding depends on NPS pioneering activity, while Nfya binding is largely independent of NPS. (F) Diagram illustrating TF motifs located at the accessible regions near klf17. See also Figure S4. |
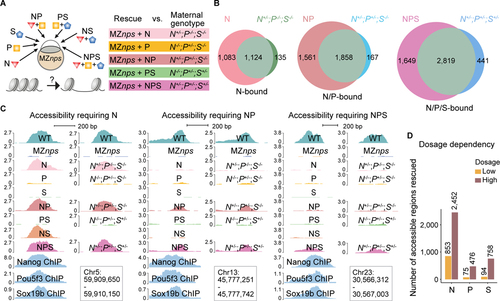
Nanog, Pou5f3, and Sox19b function independently and cooperatively to remodel chromatin.
(A) Schematic illustrating the approach to test the pioneering activity of N, P, and S – alone and in combination - by either TF restoration (N, P, and S denote the injected mRNAs) in MZnps embryos, or different combinations of mutants deprived of maternal contribution of the corresponding TFs. (B) Venn diagrams showing significant overlap of Group 1 regions that are rescued in different TF conditions (top left of each diagram) and corresponding genotypes (top right of each diagram). For example, most regions where accessibility was rescued by N (restoring Nanog in Maternal-zygotic-nanog−/−;pou5f3−/−;sox19b−/−) remain accessible in the N+/−;P−/−;S−/− (Maternal-nanog+/−;pou5f3−/−;sox19b−/−) mutant embryos. (N (P < 10−100); NP (P < 10−100); NPS (P = 1.1 × 10−93) Fisher’s exact test). (C) Representative genome tracks showing accessibility in different rescue conditions and corresponding genotypes at regions that require one, two, and three NPS factors to rescue accessibility. (D) Bar plot comparing the number of regions in Group 1 that were bound and can be rescued by N, P, and S at low and high dosage. See also Figure S5. |
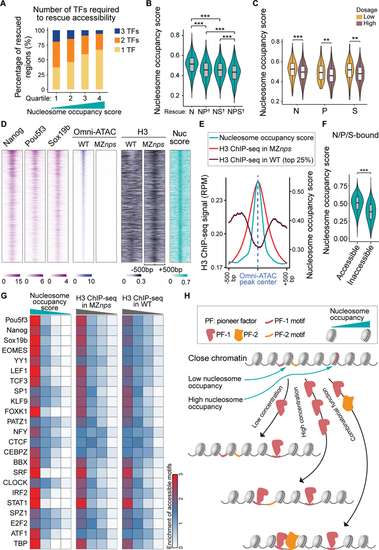
Nucleosome occupancy facilitates pioneering activity of Nanog, Pou5f3, and Sox19b.
(A) Stacked bar plot showing the percentage of N/P/S-bound Group 1 regions that require one, two, or three NPS factors to rescue accessibility. All regions were ranked by average nucleosome occupancy score and then divided into quartiles. (B) Violin plot comparing the nucleosome occupancy scores between Nanog-bound regions that are rescued by single, double, or triple factor combination (two-sample t-test, *** P <0.001). On the x-axis, † denotes regions that require two or three factors for rescue. (C) Violin plot comparing nucleosome occupancy between low and high dosage groups in Figure 5D (two-sample t-test, *** P <0.001, ** P <0.01). (D) Heatmaps of Omni-ATAC, H3, and NPS binding signal, and nucleosome occupancy score (nuc score) at N/P/S-bound Group 1 regions that can be rescued by any single/double/triple NPS factors. Heatmaps are centered at Omni-ATAC peak summits and ranked by average intensity of Omni-ATAC signal in wild-type (WT) embryos. (E) Line plot of nucleosome occupancy score, H3 signal in MZnps embryos, and H3 signal (top 25% accessible) in WT embryos at the regions in (D). (F) Violin plot comparing the nucleosome occupancy between N/P/S-bound accessible regions and inaccessible regions (two-sample t-test, *** P <0.001). (G) Heatmaps showing accessibility enrichment for TF motifs (Figure 4B) in different quartiles ranked by nucleosome occupancy score, and H3 ChIP-seq signal in MZnps and WT. (H) Schematic illustrating how nucleosome occupancy facilitates pioneering activity. See also Figure S6. |