
FIGURE
Figure 2
- ID
- ZDB-FIG-230314-71
- Publication
- Ouyang et al., 2023 - Transcriptomes of Zebrafish in Early Stages of Multiple Viral Invasions Reveal the Role of Sterols in Innate Immune Switch-On
- Other Figures
- All Figure Page
- Back to All Figure Page
Figure 2
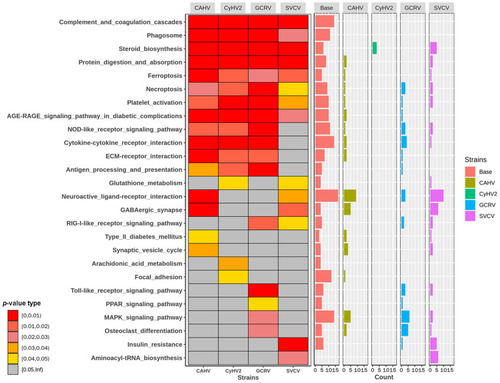
Diagrams of enriched pathways based on DEGs and PBGs in infections by four viruses, respectively. Heat map: The p-values of the enriched pathway based on the DEGs and PBGs per virus. Bar plot: The number of PBGs and non-PBGs per virus in each enriched pathway. |
Expression Data
Expression Detail
Antibody Labeling
Phenotype Data
Phenotype Detail
Acknowledgments
This image is the copyrighted work of the attributed author or publisher, and
ZFIN has permission only to display this image to its users.
Additional permissions should be obtained from the applicable author or publisher of the image.
Full text @ Int. J. Mol. Sci.