
Image
|
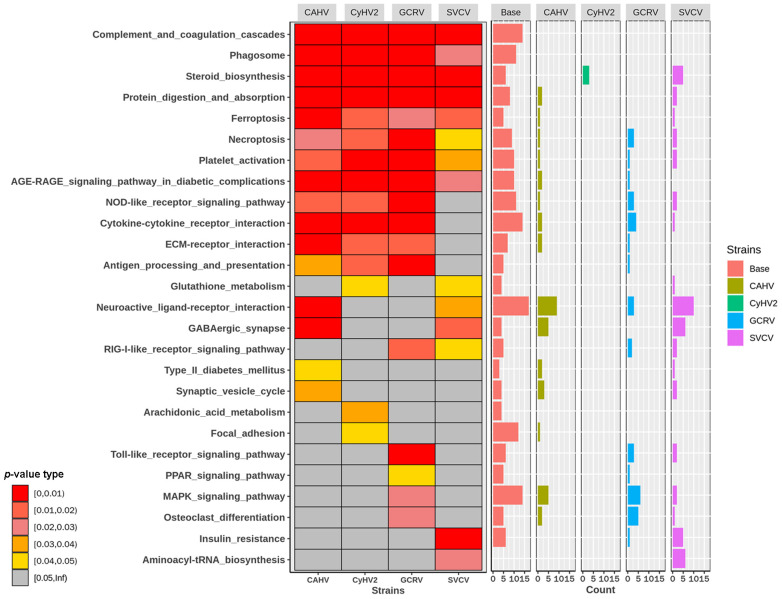
Figure Caption
Figure 2
Diagrams of enriched pathways based on DEGs and PBGs in infections by four viruses, respectively. Heat map: The p-values of the enriched pathway based on the DEGs and PBGs per virus. Bar plot: The number of PBGs and non-PBGs per virus in each enriched pathway.
Acknowledgments
This image is the copyrighted work of the attributed author or publisher, and
ZFIN has permission only to display this image to its users.
Additional permissions should be obtained from the applicable author or publisher of the image.
Full text @ Int. J. Mol. Sci.