
Fig. 5
- ID
- ZDB-FIG-230312-57
- Publication
- Yoshimatsu et al., 2021 - Ancestral circuits for vertebrate color vision emerge at the first retinal synapse
- Other Figures
- All Figure Page
- Back to All Figure Page
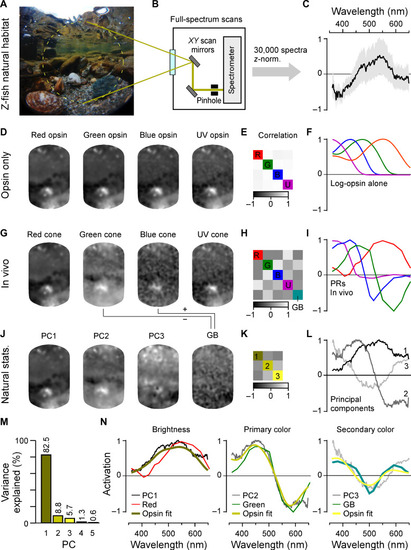
In vivo cone tunings efficiently represent statistics of natural light. (A to C) Hyperspectral data acquisition from zebrafish natural visual world. A 60° window around the visual horizon of an example scene recorded in the zebrafish natural habitat (A) was sampled at 1000 equispaced points with a custom-built spectrometer-based scanner (13) (B) to yield 1000 individual spectral readings from that scene. (C) Summary of the pooled and z-normalized data from n = 30 scenes (30,000 spectra) with mean ± SD [data from (14)]. Photo credit (A): Tom Baden, University of Sussex. (D to L) Reconstructions and analysis of the example scene as seen through different spectral filters: (D to F) log-opsin spectra, (G to I) cone in vivo tunings, and (J to L) based on the first three PCs that emerge from the hyperspectral data shown in (C). From left to right: (D, G, and J) example scene [from (A)] reconstructed on the basis of opsin/in vivo/PC tunings as indicated, (E, H, and K) correlation matrices between these respective reconstructions, and (F, I, and L) the actual tunings/PCs. A fifth element GB (for “green/blue”) is computed for in vivo tunings as contrast between green and blue cone tunings (cf. fig. S5). (M) Percent variance explained by the first five PCs (l). (N) Superposition of cone in vivo tunings (colored lines), PCs, and a linear R/G/B/U log-opsin fit to the respective PC (yellow; Methods). The latter fit can be seen as the biologically plausible optimum match to a given PC that can be achieved in a linear regime. |