
Fig. 2
- ID
- ZDB-FIG-230312-54
- Publication
- Yoshimatsu et al., 2021 - Ancestral circuits for vertebrate color vision emerge at the first retinal synapse
- Other Figures
- All Figure Page
- Back to All Figure Page
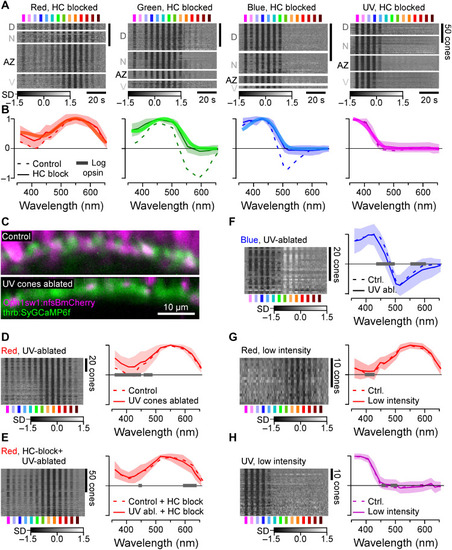
Opsin-like cone responses in the absence of HCs. (A and B) Population responses of each cone type during pharmacological blockage of HCs (A) (Methods) and population mean ± 95% confidence intervals with log-transformed respective opsin template superimposed (B) (Methods). (C) Pharmacogenetic UV cone ablation in the background of red cone GCaMP labeling before (top) and 24 hours after 2-hour treatment of metronidazole (10 mM) application (bottom) (Methods). (D and E) Red cone tunings after UV cone ablation (n = 77) (D) and after additional pharmacological HC blockage (n = 103) (E). Heatmaps (left) and means ± SD (solid lines and shadings) and analogous data in the presence of UV cones (dotted, from Figs. 1F and and2B)2B) are shown. Note that the 361-nm LED was omitted in this experiment. (F) As (D), but here, recording from blue cones (n = 30). (G and H) Red (n = 17) (G) and UV cone tunings (n = 43) (H) at about ninefold reduced overall stimulus-light intensities (solid lines and shadings; Methods), compared to tunings at “standard” light intensities (from Fig. 1F). Gray bars on the x axis in (D) to (H) indicate significant differences based on the 99% confidence intervals of the fitted generalized additive models (GAMs) (Methods). Note that heatmaps (A and D to H) are time-inverted to facilitate comparison to summary plots (B and D to H). Grayscale bars are in z scores. |