Fig. 2
- ID
- ZDB-FIG-230312-30
- Publication
- Nam et al., 2022 - The Novel Human HtrA2 Ortholog in Zebrafish: New Molecular Insight and Challenges into the Imbalance of Homeostasis
- Other Figures
- All Figure Page
- Back to All Figure Page
|
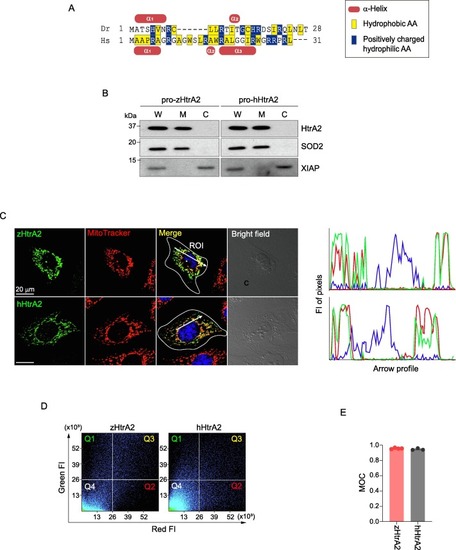
Fig. 2. zHtrA2 is primarily localized in the mitochondria. (A) Alignment of the N-terminal region of pro-HtrA2 proteins. Shown boxes are the AAs classified according to the characteristics of the R groups of each AA. (B) Biochemical determination of the mitochondrial localization of zHtrA2. The HEK293T cells that were transfected to express HtrA2 proteins were lysed. The whole-cell lysates (W) were separated into mitochondrial (M) and cytosolic (C) fractions and probed with antibodies against XIAP and SOD2, which are cytosolic and mitochondrial markers, respectively. (C) Confocal images of the mitochondrial localization of zHtrA2. The HtrA2 (green) was immunostained with FLAG Ab. The mitochondria (red) and nuclei (blue) were stained with MitoTrackerTM Red CMXRos, which accumulates in the mitochondria of live cells upon the mitochondrial membrane potential, and DAPI, respectively. The fluorescence images were taken with a confocal laser scanning microscope (LSM800 w/Airyscan). The region of interest (ROI) in the selected cells was drawn using the Zen software. The graphs on the right panel show the fluorescence intensity (FI, y-axis) of the green, red and blue pixels on the white arrow (x-axis). (D) Scatterplot analysis of the mitochondrial localization of zHtrA2. Each green (HtrA2) and red (mitochondria) pixel in the confocal images were plotted in the scatter diagram. The color of quadrant (Q) corresponds to the pixels with a high FI of the targets, and Q3 represents the pixels with a high FI of both green and red, indicating their colocalization. Q1, high green and low red; Q2, high red and low green; Q4, low green and red. (E) Quantitative validation of the mitochondrial localization of zHtrA2 in single cells. Values are representative of Manders’ Overlap Coefficients (MOC) automatically calculated by the Zen software on scatterplots (d) (n = 3–4 different cells). The data were calculated as means ± standard error of the mean (SEM). |
Reprinted from Gene, 819, Nam, M.K., Moon, J.M., Kim, G.Y., Min Kim, S., Rhim, H., The Novel Human HtrA2 Ortholog in Zebrafish: New Molecular Insight and Challenges into the Imbalance of Homeostasis, 146263, Copyright (2022) with permission from Elsevier. Full text @ Gene

