|
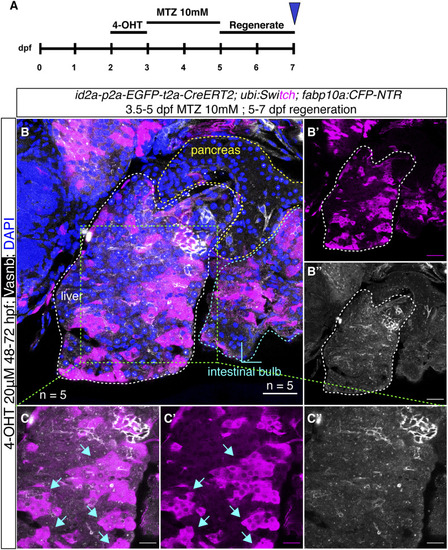
<italic toggle='yes'>id2a</italic> lineage-traced cells in an extreme liver injury model.(A) Experimental timeline of id2a lineage tracing in an MTZ/NTR-induced extreme liver injury model. (B) Representative confocal images of id2a lineage-traced cells in the extreme liver injury model. In total, we scanned five samples with 21–35 single planes in each zebrafish larvae. The white dashed lines indicate the liver, the yellow dashed lines indicate the pancreas, and the cyan dashed lines indicate the intestinal bulb. (C) Magnified image of the liver showing large numbers of regenerated hepatocytes lineage-traced back to an id2a+ cellular origin. The arrows point to clusters of regenerated hepatocytes. (B, C) Scale bars = 40 μm (B) and 20 μm (C).
|