
Fig. 3
- ID
- ZDB-FIG-230306-40
- Publication
- Castranova et al., 2022 - Long-Term Imaging of Living Adult Zebrafish
- Other Figures
- All Figure Page
- Back to All Figure Page
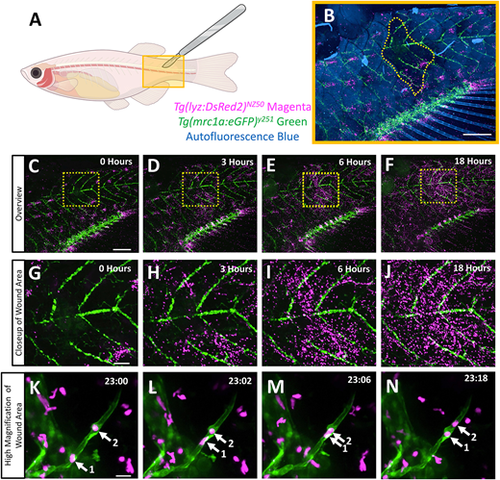
Long-term time-lapse imaging of neutrophil recruitment to a scale-removal wound in an intubated adult zebrafish. (A) Schematic diagram of an adult casper Tg(lyz:DsRed2)NZ50;Tg(mrc1a:eGFP)y251 double transgenic zebrafish. The approximate site of scale removal by abrasion with a scalpel is noted with a yellow box. (B) An overview image of the wound area (yellow box in A) at the start of time-lapse imaging. Fluorescent neutrophils (magenta), lymphatic vessels (green) and auto-fluorescent scales (blue) are visible. The yellow dashed line indicates the boundary of the site where auto-fluorescent blue scales were removed. (C-N) Maximum intensity projection still images from long-term time-lapse confocal imaging of the adult fish in B. (C-F) Overview confocal images of the trunk at 0 (C), 3 (D), 6 (E) and 18 (F) hours. (G-J) Close-up images of the boxed regions in C-F. (K,L) High-magnification images of neutrophils (magenta) actively migrating in and around lymphatic vessels (green) in the recovering wound site of a live adult zebrafish after 23:00 (K), 23:02 (L), 23:06 (M) and 23:18 (N) of time-lapse imaging (h:min). See Movie 1 for the full time-lapse sequences, including the images in C-N. Arrows indicate two neutrophils migrating inside a lymphatic vessel. Scale bars: 1 mm in B-F; 250 µm in G-J; 25 µm in K-N. |