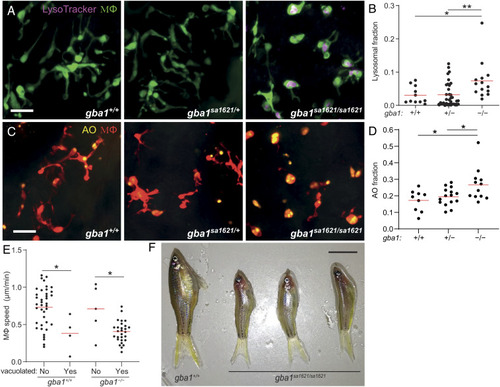
gba1 mutant zebrafish manifest Gaucher disease. (A) Maximum intensity projection of pseudocolored representative confocal images of YFP-expressing macrophages stained with LysoTracker Red in 3 dpf zebrafish brains. (Scale bar, 20 μm.) (B) LysoTracker Red volume per macrophage in 3 dpf brains. Each point represents the mean volume fraction per macrophage in each brain. Horizontal red bars, means; *P < 0.05; **P < 0.01 (one-way ANOVA with Tukey’s posttest). Representative of at least three independent experiments. (C) Maximum intensity projection of representative confocal images of tdTomato-expressing macrophages stained with AO in 3 dpf zebrafish brains. (Scale bar, 20 μm.) (D) AO volume per macrophage in the brains of 3 dpf zebrafish. Each point represents the average AO volume fraction per macrophage in each fish. Horizontal red bars, means; *P < 0.05 (one-way ANOVA with Tukey’s posttest). (E) Homeostatic migration speed of normal and vacuolated macrophages in the brains of 3 dpf zebrafish. Each point represents the mean speed of an individual macrophage from the same animal per indicated genotype during 2 h observation. Horizontal red bars, means. *P < 0.05 (one-way ANOVA with Tukey’s posttest). Representative of two to three animals for each genotype. (F) Representative images of three gba1sa1621/sa1621 fish and their wild-type sibling at 77 d after fertilization (dpf). (Scale bar, 1 cm.)