Fig. 2
- ID
- ZDB-FIG-230226-35
- Publication
- Tang et al., 2022 - Single-cell resolution of MET- and EMT-like programs in osteoblasts during zebrafish fin regeneration
- Other Figures
- All Figure Page
- Back to All Figure Page
|
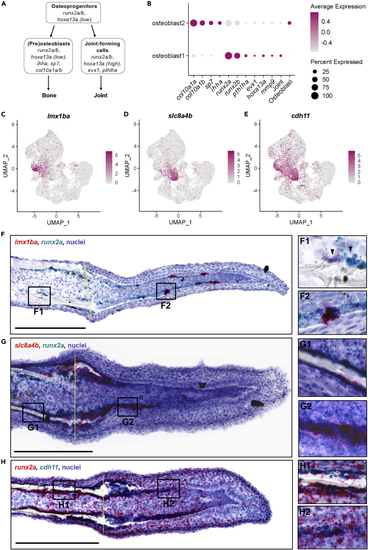
Osteoblast1 and osteoblast2 are likely enriched with cells fated to become joint cells and osteoblasts, respectively (A) Schematic of osteoprogenitor differentiation into either osteoblasts or joint-forming cells and corresponding gene markers (adapted from McMillan et al., 2018). (B) Dotplot comparing the expression of joint cell markers and bone markers in the two osteoblast populations. The clusters osteoblast1 and osteoblast2 are enriched with genes associated with joint-forming cells and osteoblasts, respectively. (C–E) Feature plots for lmx1ba, slc8a4b, and cdh11. (F-H) Dual RNA in situ hybridization in 3 dpa fin cryosections for the indicated genes. All scale bars are 200 μm. Amputation planes are indicated with a yellow dotted line. (F) lmx1ba+/runx2a+ cells were present in cells near the native joint (F1 inset, black arrowheads), and in presumptive joint cells in the regenerate (F2 inset). (G) slc8a4b+/runx2a+ cells were present at the amputation stump, near the regenerating bone, and in cells along the proximal lateral mesenchymal compartment. (H) cdh11+ cells lined the native bone (H1 inset), the regenerating bone near the amputation stump, and cells along the lateral edges of the mesenchymal compartment of the blastema (H2 inset). |

