
Fig. 1
- ID
- ZDB-FIG-230219-21
- Publication
- Hsu et al., 2022 - SIX1 reprograms myogenic transcription factors to maintain the rhabdomyosarcoma undifferentiated state
- Other Figures
- All Figure Page
- Back to All Figure Page
SIX1 is overexpressed and predicted to be an essential gene in RMS
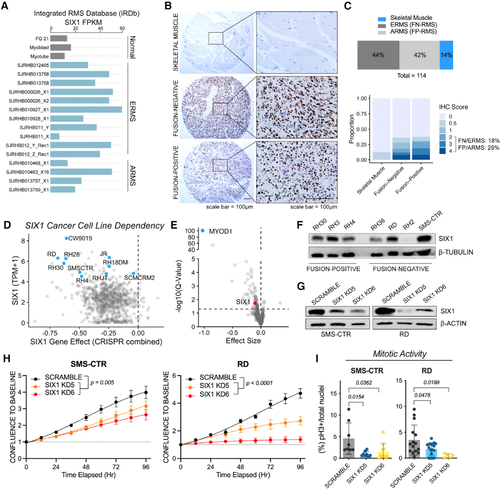
(A) Fragments per kilobase million (FPKM) for SIX1 in the St. Jude Pediatric Cancer Genome Project cohort (gray, normal skeletal muscle controls; FQ21, fetal quadriceps muscle). (B) IHC staining (DAB) for SIX1 on an RMS tissue array containing normal skeletal muscle controls. The array was counterstained with hematoxylin. (C) Distribution of samples on the RMS and skeletal muscle tissue arrays (top) and distribution of IHC scores (bottom). (D) SIX1 transcripts per kilobase million (TPM) plotted against the SIX1 gene effect score in 1,775 cell lines in the Cancer Dependency Map CRISPR-Cas9 KO screen (blue dots, RMS). (E) Volcano plot of gene dependency scores for MYOD1 (blue) and SIX1 (red) in RMS cell lines versus all other cell lines. Statistical analysis was performed using a two-class Kolmogorov-Smirnov test. (F) Western blot analysis of SIX1 across a panel of FN and FP RMS human cell lines. (G) Western blot analysis of SIX1 KD in RD and SMS-CTR cell lines. Representative KDs are shown. (H) IncuCyte live-cell imaging growth assays of SMS-CTR and RD Scramble and SIX1 KD cells over 96 h. Cells were plated in triplicate, and relative cell growth was measured by normalizing confluency at each time point relative to initial confluency. Data represent mean ± SD from one representative experiment at each time point, and statistical differences between Scramble and SIX1 KD5 or KD6 were measured by fitting data to a longitudinal mixed-effects model. (I) Mitotic activity of SMS-CTR and RD Scramble and SIX1 KD cells measured by pH3 staining and DAPI counterstaining; each dot represents data from one independent experiment. |