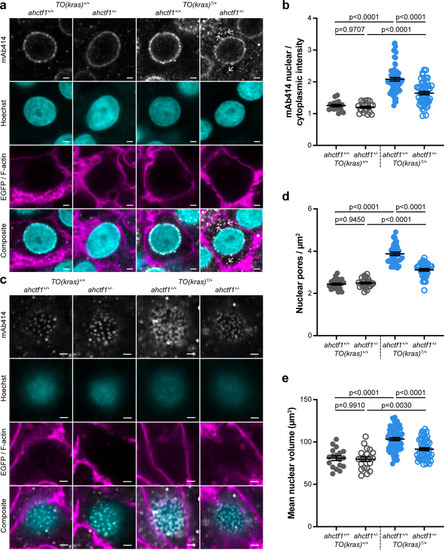
(a) Representative Airyscan imaging of liver sections stained with mAb414 (white) marking FG-NUPs, Hoechst 33342 (cyan) marking DNA, and rhodamine phalloidin (magenta) marking the F-actin cytoskeleton in non-TO(krasG12V)-expressing cells and EGFP-KrasG12V (magenta) marking the cell membrane in dox-treated TO(krasG12V)-expressing cells of the indicated ahctf1 and TO(krasG12V) genotypes. Arrows in right-hand panel point to mAb414/FG-nucleoporin staining in the cytoplasm. Scale bar 2 µm. (b) Quantification of mean nuclear/cytoplasmic fluorescence intensity of mAb414 staining after 3D segmentation and morphological filtering of nuclear and cytoplasmic areas (n > 18). (c) Representative Airyscan images of mAb414 staining at the nuclear surface of sections of the indicated ahctf1 and TO(krasG12V) genotype. Scale bar 1 µm. (d) Quantification of nuclear pore density (n ≥ 25). (e) Quantification of nuclear volume (n ≥ 25). Data are expressed as mean ± standard error of the mean (SEM). Significance was assessed using a one-way analysis of variation (ANOVA) with Tukey’s multiple comparisons test.