
FIGURE
Fig. 2
- ID
- ZDB-FIG-230124-53
- Publication
- Megat et al., 2023 - Integrative genetic analysis illuminates ALS heritability and identifies risk genes
- Other Figures
- All Figure Page
- Back to All Figure Page
Fig. 2
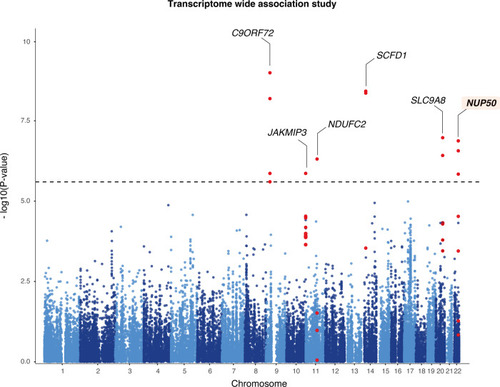
Transcriptome-wide association study of amyotrophic lateral sclerosis.
Manhattan plot of ALS transcriptome-wide association study (TWAS) using gene expression from the GTEx consortium brain tissues. The y-axis corresponds to two-tailed −log10 (P-values); the x-axis corresponds to genomic coordinates (GRCh37). The horizontal dashed line reflects the threshold for calling genome-wide significant genes (P = 5 × 10⁻⁶) after Bonferroni correction. |
Expression Data
Expression Detail
Antibody Labeling
Phenotype Data
Phenotype Detail
Acknowledgments
This image is the copyrighted work of the attributed author or publisher, and
ZFIN has permission only to display this image to its users.
Additional permissions should be obtained from the applicable author or publisher of the image.
Full text @ Nat. Commun.