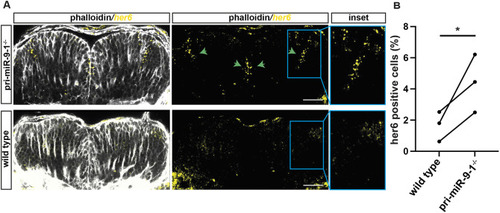
Knocking out the late pri-mir-9-1 impairs her6 downregulation over the course of development. (A) Representative example of transverse view from whole-mount smiFISH labelling her6 transcript (yellow) combined with cell boundary staining, Phalloidin-Alexa Fluor 488 (grey), in hindbrain from pri-mir-9-1 homozygote mutant (pri-mir-9-1−/−) (bottom panels) and wild-type (top panels) embryos at 48 hpf. Insets are increased magnification from representative images from boxed area. The images are maximum projections of three z-stacks, 1.89 mm. Green arrows indicate regions with high her6 expression levels in pri-mir-9-1−/− mutants. (B) Percentage of cells expressing her6 relative to total number of cells. Pairwise comparison of her6-positive cells; dots indicate mean per experiment from wild-type (two embryos, three embryos, four embryos; three independent experiments) and pri-mir-9-1 homozygote mutant (two embryos, two embryos, three embryos; three independent experiments); *P=0.041 (one-tailed paired t-test). Scale bars: 30 µm.
|
