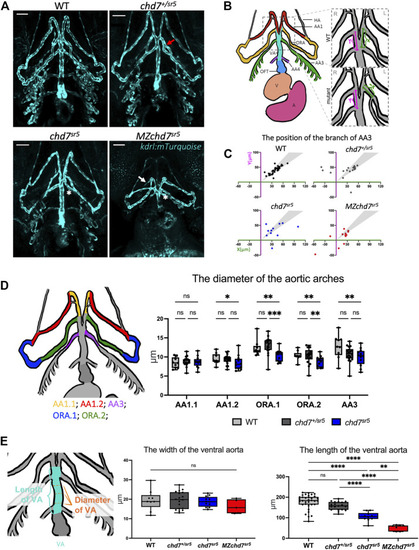
chd7 sr5 mutants show defects in arch artery patterning and ventral aorta length. (A) Ventral view of the kdrl:mTurquois fish at 102 hpf. 20x stacked confocal image, number of stacks: WT n = 25 (interval = 5 µm), chd7 sr5/+ n = 17 (interval = 7.5 µm), chd7 sr5 n = 20 (interval = 7.5 µm), and MZchd7 sr5 n = 21 (interval = 7.5 µm). Scale bar = 50 µm. (B) Schematic of ventral view of the zebrafish vasculature system at 102 hpf. The enlarged/zoomed in schematic illustrated the abnormal AA3 branching observed in some of the chd7 mutants. The distance between the branching points of the ORA and AA3 along the VA was measured. X = the length on the left side of the fish, Y = the length on the right side of the fish. If the AA3 branches off from the ORA instead of the VA, a negative value is used to quantify the length. AA, aortic arch; AA1, mandibular arch; ORA, opercular artery; AA3, first branchial arch; AA4, second branchial arch; HA, hypobranchial artery; VA, ventral aorta; OFT, outflow tract; V, ventricle; and A, atrium. (C) Quantification of the branching positions of the AA3 on the left and right side of WT, chd7 sr5, and MZchd7 sr5 as X and Y coordinates. Each spot in the scatter diagram indicates one single fish. The gray area represents the range of symmetric distributions, in which the differences of the distance between X and Y is less than 15%. (WT: n = 34, chd7 +/sr5 : n = 19, chd7 sr5 : n = 11, and MZchd7 sr5 : n = 14). (D) Schematic and data quantification of the diameter of the AA1, ORA, and AA3. Due to the variation in the diameter at different segments of the vessels, AA1 and ORA were separated into AA1.1 and AA1.2 and ORA.1 and ORA.2, respectively. (WT: n = 9, chd7 +/sr5 : n = 18, and chd7 sr5 : n = 12). The statistical analysis was performed using the two-way ANOVA test (mixed-effects analysis). (E) Schematic and data quantification of the width and length of the OFT. The mean diameter of the VA was used for quantification. The statistical analysis was performed using the ordinary one-way ANOVA test. (WT: n = 34, chd7 +/sr5 : n = 19, chd7 sr5 : n = 11, and MZchd7 sr5 : n = 14). ns: p ≥ 0.05, *: p < 0.05, **: p < 0.01, ***: p < 0.001, ****: p < 0.0001.