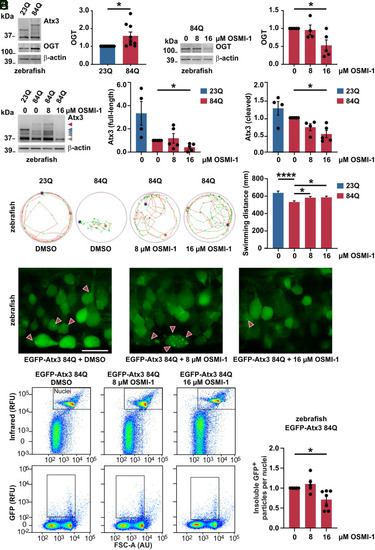
Counteracting increased OGT via its pharmacological inhibition reduces polyQ-expanded ataxin-3 levels and aggregates, alleviating motor phenotype in MJD zebrafish model. (A) Western blot of samples from MJD zebrafish larvae (84Q) and its wild-type control (23Q), depicting a baseline increase of OGT in the ataxin-3 84Q fish. β-actin served as loading control. n = 9 to 10, one-sample t test, and P = 0.028. (B) Western blot demonstrating the reduction of OGT upon 16 μM OSMI-1 treatment of Atx3 84Q zebrafish. β-actin served as loading control. n = 5 and one-sample t test; in 0 versus 16 μM OSMI-1, P = 0.036. (C) Treatment of Atx3 84Q zebrafish with 16 μM OSMI-1 also reduced Atx3 full-length (red arrowhead) and cleavage products (gray arrowheads), as demonstrated on Western blot. β-actin served as loading control. n = 4 to 5, one-sample t test; in Atx3 full-length 0 versus 16 μM OSMI-1, P = 0.014; and in Atx3 cleaved 0 versus 16 μM OSMI-1, P = 0.011. (D) Representative images of the total distance swum on a tracking system by the Atx3 23Q and 84Q DMSO-treated transgenic zebrafish and the Atx3 84Q OSMI-1-treated fish at the concentrations of 8 μM and 16 μM. Images revealed a baseline impaired swimming pattern for the 84Q fish (DMSO) when compared to the 23Q fish and an improvement of the motor function in the 84Q OSMI-1-treated fish. The graph displays the quantification of the total swum distance of the transgenic zebrafish in all conditions depicted in the images. n = 184 (23Q), 247 (84Q 0 μM), 210 (84Q 8 μM), 246 (84Q 16 μM); one-way ANOVA with Dunett’s post hoc test; in 23Q versus 84Q DMSO (0 μM OSMI-1), P < 0.0001; in 84Q 0 versus 8 μM OSMI-1, P = 0.049; and in 84Q 0 versus 16 μM, P = 0.022. (E) Confocal imaging of the Atx3 84Q zebrafish spinal cord demonstrating the reduction of ataxin-3 aggregates (red arrowheads) upon OSMI-1 treatment at 16 μM (400× magnification). Scale bar, 15 μm. (F) Flow cytometric analysis of dissociated zebrafish cells expressing EGFP-tagged Atx3 84Q demonstrated the reduction of ataxin-3 aggregates (insoluble GFP+ particles) upon 16 μM OSMI-1 treatment. Nuclei of live cells were stained and identified based on the intensity of infrared fluorescence. RFU, relative fluorescence units; FSC-A (AU), forward scatter area, arbitrary unit. The graph displays the quantification of ataxin-3 aggregates at 0 μM (DMSO), 8 μM, and 16 μM OSMI-1 treatment. n = 5 to 7, one-sample t test, and P = 0.018. Data are represented as means ± SEM, *P ≤ 0.05, and ****P ≤ 0.0001.
|
