
Fig. 1
- ID
- ZDB-FIG-221214-8
- Publication
- Engerer et al., 2021 - Notch-mediated re-specification of neuronal identity during central nervous system development
- Other Figures
- All Figure Page
- Back to All Figure Page
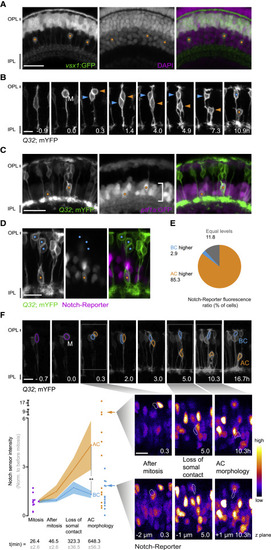
Figure 1. Vsx1 progenitors generate ACs (A) 3 dpf vsx1:GFP retina with vsx1+ BCs and ACs (orange circles). (B) 2 dpf Q32 progenitor undergoing mitosis (M), generates a BC (cyan arrowhead; circle, final time point) and an AC (orange arrow-head, circle final time-point). (C) 3 dpf WT retina showing ptfa:GFP+ Q32 ACs (orange circles). Ptf1a:GFP labels all ACs (INL, bracket, center panel). Ptf1a-GFP signal bleeds through Q32-YFP channel. (D) 3 dpf retina showing Notch-reporter (tp1:hmgb1mCherry) expression in a Q32 AC (orange circle), but not in surrounding Q32 s BCs (cyan circles). (E) Notch-reporter (tp1:hmgb1mCherry) fluorescence intensity in Q32 ACs and BCs. AC and BC categories were tested against an expected frequency of 50% using a binomial test, p < 0.0001; 30 cells, 10 fish. Four ACs (of 34) displayed equal levels of fluorescence as neighboring BCs. (F) 2 dpf transgenic retina (Q32; mYFP; tp1:H2BmCherry; top grayscale images, gamma adjusted) showing a WT Q32 progenitor (purple outline) generating a BC (cyan) and an AC (orange). Notch-reporter levels in the AC and BC depicted using a Fire LUT (below, right). Notch-reporter intensity levels (means ± SEMs) for 13 Q32 progenitors (8 fish) and their BC (cyan) and AC (orange) daughters (below, left). Times in relation to the time point before mitosis. Significant differences between BC-AC pairs were found when the AC acquired its characteristic morphology (Wilcoxon matched-pairs signed-rank test, p = 0.0061). Scale bars, 20 μm (A and C); 10 μm (B, D, and F). IPL, inner plexiform layer; OPL, outer plexiform layer. See also Figures S1A, S2, and S3A–S3C. |